在Python中使用 Matplotlib 更改颜色条的标签大小和刻度标签大小
在本文中,我们将学习如何使用Python在 Matplotlib 中更改颜色条的标签大小和刻度标签大小。
标签是一种分配名称,可以应用于图中的任何节点。它们只是一个名称,因此标签要么存在要么不存在。要正确标记图形,有助于识别 x 轴和 y 轴。每个刻度线表示连续刻度上的指定单位值或分类刻度上的类别值。 X 轴和 Y 轴在图中标出。
在这里,我们将讨论如何更改颜色条的标签大小和刻度标签大小,并使用不同的示例使其更加清晰。
句法:
# Change the label size
im.figure.axes[0].tick_params(axis=”both”, labelsize=21)
- axis = x, y or both.
- labelsize = int
# Change the tick label size of color-bar
im.figure.axes[1].tick_params(axis=””, labelsize=21)
- axis = x, y or both.
- labelsize = int
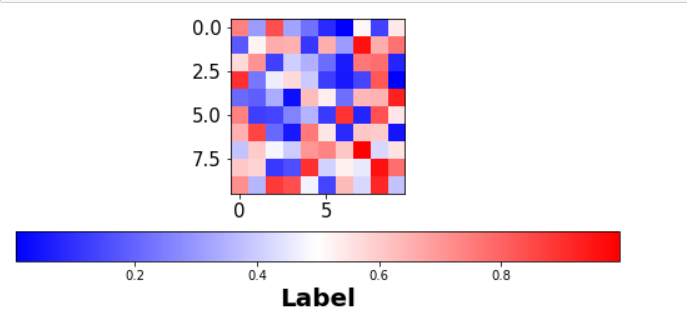
示例 1:在此示例中,我们在方法im.figure.axes[0].tick_params(axis=”both”, labelsize=21)的帮助下更改 Plotly Express 中的标签大小,通过将参数轴值传递为轴和标签大小都为 21。
Python3
# importing libraries
import numpy as np
import matplotlib as mpl
import matplotlib.pyplot as plt

# setup data
a = np.random.rand(10, 10)
im = plt.imshow(a, cmap="bwr")
cb = plt.colorbar(im, orientation='horizontal')

# change the label size
im.figure.axes[0].tick_params(axis="both", labelsize=21)

plt.show()
Python3
# importing libraries
import numpy as np
import matplotlib as mpl
import matplotlib.pyplot as plt

# setup data
a = np.random.rand(10, 10)
im = plt.imshow(a, cmap="bwr")
cb = plt.colorbar(im, orientation='horizontal')

# change the tick label size of colorbar
im.figure.axes[1].tick_params(axis="x", labelsize=18)

plt.show()
Python3
# importing libraries
import numpy as np
from matplotlib import pyplot as plt

# setup data
plt.rcParams["figure.figsize"] = [7.00, 3.50]
plt.rcParams["figure.autolayout"] = True
data = np.random.rand(6, 6)
im = plt.imshow(data, interpolation="nearest", cmap="Accent")
cbar = plt.colorbar(im)

# change the label size
im.figure.axes[0].tick_params(axis="both", labelsize=21)

# change the tick label size of colorbar
im.figure.axes[1].tick_params(axis="y", labelsize=21)

plt.show()
输出:

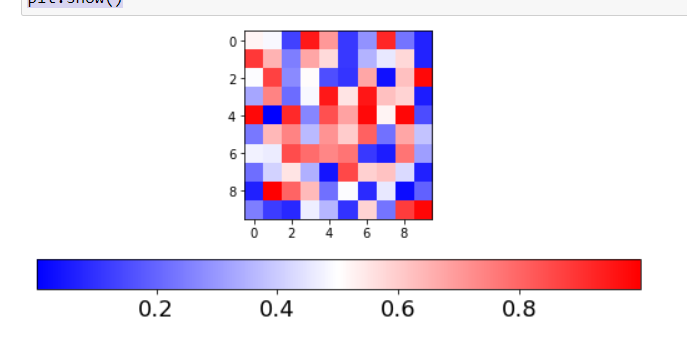
示例 2:在本示例中,我们在方法im.figure.axes[0].tick_params(axis=”x”, labelsize=18)的帮助下更改 Plotly Express 中的标签大小,将参数轴值传递为x 和标签大小为 18。
Python3
# importing libraries
import numpy as np
import matplotlib as mpl
import matplotlib.pyplot as plt

# setup data
a = np.random.rand(10, 10)
im = plt.imshow(a, cmap="bwr")
cb = plt.colorbar(im, orientation='horizontal')

# change the tick label size of colorbar
im.figure.axes[1].tick_params(axis="x", labelsize=18)

plt.show()
输出:

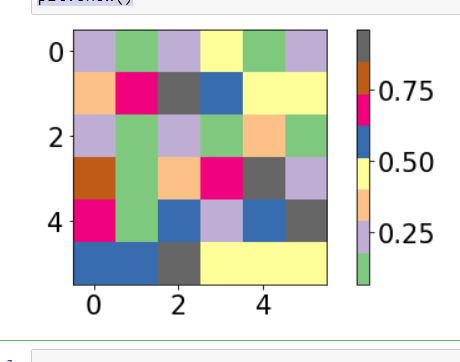
示例 3:在此示例中,我们在方法im.figure.axes[0].tick_params(axis=”y”, labelsize=21)的帮助下更改 Plotly Express 中的标签大小,绕过参数轴值为 y和标签大小为 21。
Python3
# importing libraries
import numpy as np
from matplotlib import pyplot as plt

# setup data
plt.rcParams["figure.figsize"] = [7.00, 3.50]
plt.rcParams["figure.autolayout"] = True
data = np.random.rand(6, 6)
im = plt.imshow(data, interpolation="nearest", cmap="Accent")
cbar = plt.colorbar(im)

# change the label size
im.figure.axes[0].tick_params(axis="both", labelsize=21)

# change the tick label size of colorbar
im.figure.axes[1].tick_params(axis="y", labelsize=21)

plt.show()
输出:
