基础 R 中的叠加密度图
在本文中,我们将讨论如何使用 R 编程语言的一些基本函数来叠加密度图。叠加密度图意味着在单个图上创建不同数据的一些密度图。
使用的功能
- Plot() :这是一个用于绘制 R 对象的通用函数。
Syntax:
plot(x, y, …)
Parameters:
- x: the coordinates of points in the plot.
- y: the y coordinates of points in the plot,
- …: Arguments to be passed to methods, such as graphical parameters
- Density():这是一个计算核密度估计的通用函数密度。它的默认方法使用给定的内核和带宽进行单变量观察。
Syntax:
density(x,…)
Parameters:
- x:-the data from which the estimate is to be computed.
- …:-further arguments for (non-default) methods.
Returns:
This function will be returning the density plot of the given data.
- Lines():这是一个通用函数,采用各种方式给出的坐标,并将相应的点与线段连接起来。
Syntax:
lines(x, …)
Parameters:
- x:-coordinate vectors of points to join.
- …:-Further graphical parameters
- R 使用hist()函数创建直方图。
Syntax:
hist(v, main, xlab, xlim, ylim, breaks, col, border)
Parameters:
- v: This parameter contains numerical values used in histogram.
- main: This parameter main is the title of the chart.
- col: This parameter is used to set color of the bars.
- xlab: This parameter is the label for horizontal axis.
- border: This parameter is used to set border color of each bar.
- xlim: This parameter is used for plotting values of x-axis.
- ylim: This parameter is used for plotting values of y-axis.
- breaks: This parameter is used as width of each bar.
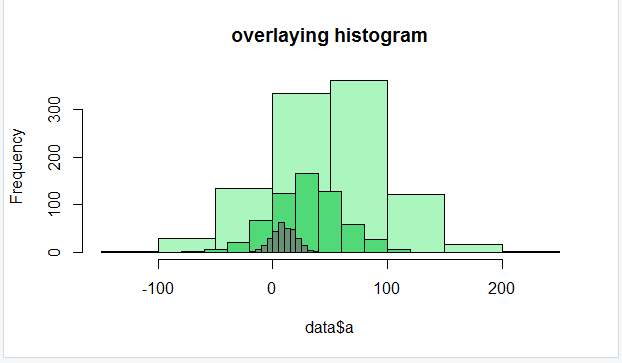
叠加两个密度图可能看起来很复杂,但它就像绘制相同的密度图一样简单。对于每个其他图,您只需要继续以各自的密度调用函数,并将其所需的机制添加到函数中,除了第一个函数,以继续在同一图上绘制它们。
示例 1:
R
gfg <-rnorm(500)

a <- rnorm(200)
b <- rnorm(100)

plot(density(gfg))
lines(density(a), col = "red")
lines(density(b), col = "green")

legend("topright", c("gfg", "a", "b"),
       col =c("black","red","green"), lty=1)
R
set.seed(99990)

data<-data.frame(a=round(rnorm(1000,50,50)))
data2<-data.frame(b=round(rnorm(600,30,30)))
data3<-data.frame(c=round(rnorm(300,10,10)))

hist(data$a, col="#abf5bf",main="overlaying histogram")
hist(data2$b, col="#52d977", add=T)
hist(data3$c, col="#669172", add=T)
输出:

示例 2:
电阻
set.seed(99990)

data<-data.frame(a=round(rnorm(1000,50,50)))
data2<-data.frame(b=round(rnorm(600,30,30)))
data3<-data.frame(c=round(rnorm(300,10,10)))

hist(data$a, col="#abf5bf",main="overlaying histogram")
hist(data2$b, col="#52d977", add=T)
hist(data3$c, col="#669172", add=T)
输出:
