如何在 R 中的特定数据点周围添加圆圈
在本文中,我们将讨论如何在 R 编程语言中围绕特定数据点添加圆圈。
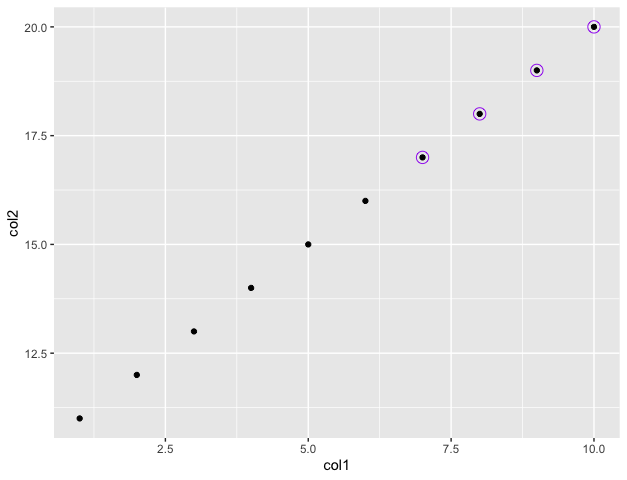
方法一:使用geom_point方法
R 中的 ggplot2 包用于执行数据可视化。要安装此软件包,请在终端中键入以下命令。
句法:
install.packages("ggplot2")可以为绘图对象创建美学映射,以分别确定 x 轴和 y 轴之间的关系。可以将其他组件添加到创建的 ggplot 对象中。
句法:
ggplot(data = NULL, mapping = aes())参数 :
- data – 用于绘图的默认数据集。
- mapping – 用于绘图的美学映射列表。
还可以使用附加映射来指定几何图形,例如颜色以对属于不同组的点进行不同的着色。
句法:
geom_point(cond, pch, size, colour)通过指定要应用于数据框的条件,可以在数据点周围添加圆圈。可以使用 geom_point() 方法的参数指定圆的大小及其对应的颜色。
例子:
R
# importing required libraries
library("ggplot2")

# creating data frame
df < - data.frame(col1=c(1: 10),
                  col2=c(11: 20))

# plotting the data
df % >%
ggplot(aes(x=col1, col2))+
geom_point()+

# encircling points where col1 value is more than 6
geom_point(data=df % > % filter(col1 > 6),
           pch=21,
           size=4,
           colour="purple")
R
# creating data frame
col1 = c(1: 10)
col2 = c(11: 20)
print("X coordinates")
print(col1)
print("Y coordinates")
print(col2)

# plotting the data frame
plot(col1, col2)

# adding circles around the points
symbols(x=c(1, 8), y=c(11, 18), circles=c(0.16, 0.4),
        add=T, inches=F, fg=c('red', 'blue'))
输出
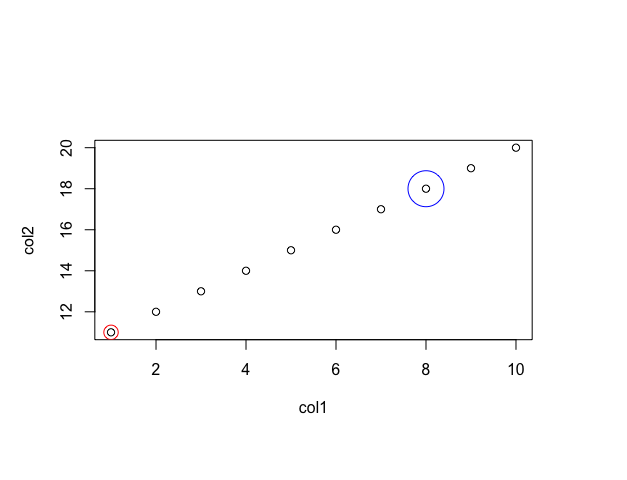
方法二:使用符号方法
基础 R 中的 plot() 方法用于绘制使用 x 和 y 坐标指定的一组数据点。 R 中的符号()方法可用于在它们周围添加圆圈。
句法:
symbols (x, y , circles = c() , add , fg)参数 :
- x, y – 符号中心的 x 和 y 坐标。
- circles – 给出圆半径的向量。
- add – 如果 add 的参数值为 TRUE,则将符号添加到现有绘图中,否则创建新绘图。
- fg – 要绘制符号的颜色向量。
示例:此代码分别用红色和蓝色包围属于坐标 (1,11) 和 (8,18) 的点:
电阻
# creating data frame
col1 = c(1: 10)
col2 = c(11: 20)
print("X coordinates")
print(col1)
print("Y coordinates")
print(col2)

# plotting the data frame
plot(col1, col2)

# adding circles around the points
symbols(x=c(1, 8), y=c(11, 18), circles=c(0.16, 0.4),
        add=T, inches=F, fg=c('red', 'blue'))
输出
[1] "X coordinates"
[1]  1  2  3  4  5  6  7  8  9 10
[1] "Y coordinates"
[1] 11 12 13 14 15 16 17 18 19 20