Python|使用 NumPy 数组进行广播
广播一词是指 numpy 在算术运算期间如何处理具有不同维度的数组,这会导致某些约束,较小的数组在较大的数组中广播,以便它们具有兼容的形状。
广播提供了一种向量化数组操作的方法,以便循环发生在 C 中而不是Python中,因为我们知道 Numpy 是在 C 中实现的。它这样做不会产生不必要的数据副本,从而导致高效的算法实现。在某些情况下,广播不是一个好主意,因为它会导致内存使用效率低下,从而减慢计算速度。
例子 -
Python3
import numpy as np

A = np.array([5, 7, 3, 1])
B = np.array([90, 50, 0, 30])

# array are compatible because of same Dimension
c = a * b
print (c)
Python3
macros = array([
  [0.8, 2.9, 3.9],
  [52.4, 23.6, 36.5],
  [55.2, 31.7, 23.9],
  [14.4, 11, 4.9]
   ])

# Create a new array filled with zeros,
# of the same shape as macros.
result = zeros_like(macros)

cal_per_macro = array([3, 3, 8])

# Now multiply each row of macros by
# cal_per_macro. In Numpy, `*` is
# element-wise multiplication between two arrays.
 for i in range(macros.shape[0]):
     result[i, :] = macros[i, :] * cal_per_macro

result
Python3
import numpy as np
a = np.array([17, 11, 19]) # 1x3 Dimension array
print(a)
b = 3
print(b)

# Broadcasting happened because of
# miss match in array Dimension.
c = a + b
print(c)
Python3
import numpy as np
A = np.array([[11, 22, 33], [10, 20, 30]])
print(A)

b = 4
print(b)

C = A + b
print(C)
Python3
import numpy as np

v = np.array([12, 24, 36])
w = np.array([45, 55])

# To compute an outer product we first
# reshape v to a column vector of shape 3x1
# then broadcast it against w to yield an output
# of shape 3x2 which is the outer product of v and w
print(np.reshape(v, (3, 1)) * w)

X = np.array([[12, 22, 33], [45, 55, 66]])

# x has shape  2x3 and v has shape (3, )
# so they broadcast to 2x3,
print(X + v)

# Add a vector to each column of a matrix X has
# shape 2x3 and w has shape (2, ) If we transpose X
# then it has shape 3x2 and can be broadcast against w
# to yield a result of shape 3x2.

# Transposing this yields the final result
# of shape  2x3 which is the matrix.
print((x.T + w).T)

# Another solution is to reshape w to be a column
# vector of shape 2X1 we can then broadcast it
# directly against X to produce the same output.
print(x + np.reshape(w, (2, 1)))

# Multiply a matrix by a constant, X has shape  2x3.
# Numpy treats scalars as arrays of shape();
# these can be broadcast together to shape 2x3.
print(x * 2)
Python3
import numpy as np
import matplotlib.pyplot as plt

# Computes x and y coordinates for
# points on sine and cosine curves
x = np.arange(0, 3 * np.pi, 0.1)
y_sin = np.sin(x)
y_cos = np.cos(x)

# Plot the points using matplotlib
plt.plot(x, y_sin)
plt.plot(x, y_cos)
plt.xlabel('x axis label')
plt.ylabel('y axis label')
plt.title('Sine and Cosine')
plt.legend(['Sine', 'Cosine'])

plt.show()
加深理解的例子——
假设我们有一个大数据集,每个数据都是一个参数列表。在 Numpy 中,我们有一个二维数组,其中每一行是一个数据,行数是数据集的大小。假设我们想对所有这些数据应用某种缩放,每个参数都有自己的缩放因子,或者说每个参数都乘以某个因子。
为了有一些清晰的理解,让我们使用宏量营养素分解来计算食物中的卡路里。粗略地说,食物的热量部分由脂肪(每克 9 卡路里)、蛋白质(4 cpg)和碳水化合物(4 cpg)组成。因此,如果我们列出一些食物(我们的数据),并为每种食物列出其宏量营养素分解(参数),然后我们可以将每种营养素乘以其热量值(应用缩放)来计算每种食物的热量分解。
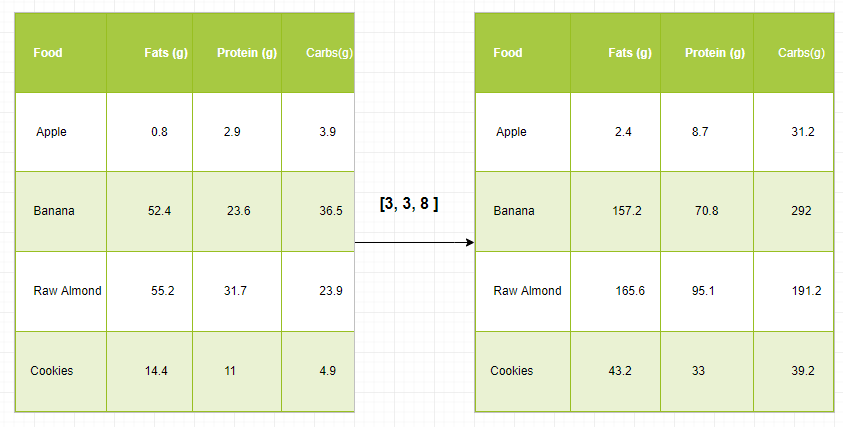
通过这种转换,我们现在可以计算各种有用的信息。例如,某些食物中的卡路里总数是多少,或者,根据我的晚餐细分,知道我从蛋白质中获得了多少卡路里等等。
让我们看看用 Numpy 产生这种计算的一种简单方法:
Python3
macros = array([
  [0.8, 2.9, 3.9],
  [52.4, 23.6, 36.5],
  [55.2, 31.7, 23.9],
  [14.4, 11, 4.9]
   ])

# Create a new array filled with zeros,
# of the same shape as macros.
result = zeros_like(macros)

cal_per_macro = array([3, 3, 8])

# Now multiply each row of macros by
# cal_per_macro. In Numpy, `*` is
# element-wise multiplication between two arrays.
 for i in range(macros.shape[0]):
     result[i, :] = macros[i, :] * cal_per_macro

result
输出:
array([[   2.4,    8.7,   31.2 ],
       [  157.2,   70.8,  292 ],
       [   165.6,  95.1,   191.2],
       [   43.2,   33,    39.2]])
算法:
输入:具有m维的数组A和具有n维的数组B
p = max(m, n)
if m < p:
    left-pad A's shape with 1s until it also has p dimensions

else if n < p:
    left-pad B's shape with 1s until it also has p dimensions
result_dims = new list with p elements

for i in p-1 ... 0:
    A_dim_i = A.shape[i]
    B_dim_i = B.shape[i]
    if A_dim_i != 1 and B_dim_i != 1 and A_dim_i != B_dim_i:
        raise ValueError("could not broadcast")
    else:
        # Pick the Array which is having maximum Dimension
        result_dims[i] = max(A_dim_i, B_dim_i)
广播规则:
一起广播两个数组遵循以下规则:
- 如果数组没有相同的等级,则在较低等级数组的形状前面加上 1,直到两个形状的长度相同。
- 如果两个数组在维度上具有相同的大小,或者如果其中一个数组在该维度上的大小为 1,则这两个数组在维度上是兼容的。
- 如果数组与所有维度兼容,则它们可以一起广播。
- 广播后,每个数组的行为就好像它的形状等于两个输入数组的元素形状的最大值。
- 在一个数组的大小为 1 而另一个数组的大小大于 1 的任何维度中,第一个数组的行为就好像它是沿该维度复制的一样。
示例 #1:单维数组
Python3
import numpy as np
a = np.array([17, 11, 19]) # 1x3 Dimension array
print(a)
b = 3
print(b)

# Broadcasting happened because of
# miss match in array Dimension.
c = a + b
print(c)
输出:
[17 11 19]
3
[20 14 22]
示例 2:二维数组
Python3
import numpy as np
A = np.array([[11, 22, 33], [10, 20, 30]])
print(A)

b = 4
print(b)

C = A + b
print(C)
输出:
[[11 22 33]
 [10 20 30]]
 4
[[15 26 37]
 [14 24 34]]
示例 3:
Python3
import numpy as np

v = np.array([12, 24, 36])
w = np.array([45, 55])

# To compute an outer product we first
# reshape v to a column vector of shape 3x1
# then broadcast it against w to yield an output
# of shape 3x2 which is the outer product of v and w
print(np.reshape(v, (3, 1)) * w)

X = np.array([[12, 22, 33], [45, 55, 66]])

# x has shape  2x3 and v has shape (3, )
# so they broadcast to 2x3,
print(X + v)

# Add a vector to each column of a matrix X has
# shape 2x3 and w has shape (2, ) If we transpose X
# then it has shape 3x2 and can be broadcast against w
# to yield a result of shape 3x2.

# Transposing this yields the final result
# of shape  2x3 which is the matrix.
print((x.T + w).T)

# Another solution is to reshape w to be a column
# vector of shape 2X1 we can then broadcast it
# directly against X to produce the same output.
print(x + np.reshape(w, (2, 1)))

# Multiply a matrix by a constant, X has shape  2x3.
# Numpy treats scalars as arrays of shape();
# these can be broadcast together to shape 2x3.
print(x * 2)
输出:
[[ 4 5]
[ 8 10]
[12 15]]
[[2 4 6]
[5 7 9]]
[[ 5 6 7]
[ 9 10 11]]
[[ 5 6 7]
[ 9 10 11]]
[[ 2 4 6]
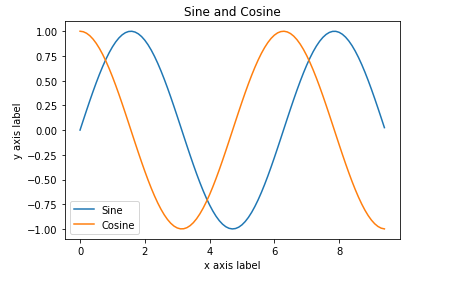
[ 8 10 12]]绘制二维函数–
广播也经常用于显示基于二维函数的图像。如果我们要定义一个函数z=f(x, y)。
例子:
Python3
import numpy as np
import matplotlib.pyplot as plt

# Computes x and y coordinates for
# points on sine and cosine curves
x = np.arange(0, 3 * np.pi, 0.1)
y_sin = np.sin(x)
y_cos = np.cos(x)

# Plot the points using matplotlib
plt.plot(x, y_sin)
plt.plot(x, y_cos)
plt.xlabel('x axis label')
plt.ylabel('y axis label')
plt.title('Sine and Cosine')
plt.legend(['Sine', 'Cosine'])

plt.show()
输出: