SciPy - 集群层次树状图
在本文中,我们将使用Python的Scipy 模块了解 Cluster Hierarchy Dendrogram。首先,我们将讨论一些相关的概念,如下所示:
层次聚类
分层聚类需要创建从上到下具有预定顺序的聚类。它是一种用于对未标记数据点进行聚类的无监督机器学习算法。
如何执行?
- 每个数据点在开始时都应该被视为一个集群。
- 将开始时的簇数表示为 K。
- 通过组合两个最近的数据点形成一个集群,从而产生 K-1 集群。
- 通过组合两个最近的集群来形成更多的集群,从而产生 K-2 集群。
- 重复以上四个步骤,直到创建一个大集群。
- 树状图用于在创建集群后立即划分为多个集群。
层次聚类的类型
1.分裂聚类
分裂聚类,也称为自上而下的聚类方法,将所有观测值分配给单个聚类,然后将该聚类划分为两个最不相似的聚类。
2. 凝聚聚类
在凝聚或自下而上的聚类方法中,每个观测值都被分配到自己的聚类中。
算法
1.单联动
单连锁聚类通常会产生聚类,其中个体按顺序添加到单个组中。两个集群之间的距离定义为它们两个最近的数据点之间的距离。
L(a , b) = min(D(xai , xbj)) 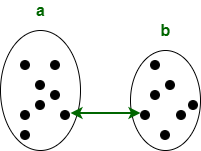
2、完整的联动
完整的连锁聚类通常会产生分离良好且紧凑的聚类。两个簇之间的距离定义为每个簇中两个数据点之间的最长距离。
L(a , b) = max(D(xai , xbj))
3. 简单平均
简单平均算法将集群之间的距离定义为每个成员之间的平均距离,加权使得两个集群对最终输出的影响相等。
L(a , b) = Tab / ( Na * Nb)
Tab: The sum of all pairwise distances between the two clusters.
Na and Nb: The sizes of the clusters a and b, respectively.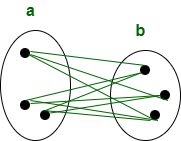
树状图
树状图是一种树状图,用于可视化集群之间的关系。树状图中垂直线的距离越远,这些簇之间的距离就越大。解释树状图的关键是关注任何两个对象连接在一起的高度。
树状图示例:
假设我们有六个聚类:P、Q、R、S、T 和 U。散点图上显示的这六个观测值的聚类层次树状图是:
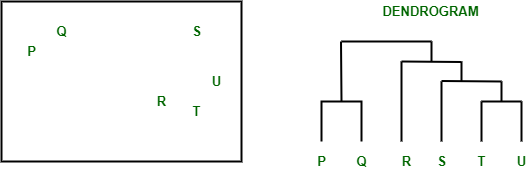
来自给定散点图的树状图
树状图的组成部分:
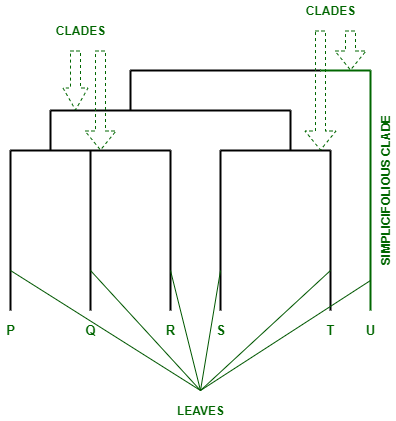
树状图的组成部分
- 树状图的分支称为进化枝。这些进化枝根据它们的相似或不同程度排列。
- 树状图的每个分支都有一个或多个叶子。 P、Q、R、S、T 和 U 是树状图的叶子:
- Triple(三叶):P、Q、R
- 双叶(bifolius):S、T
- 单(单叶):U
实现层次聚类并绘制树状图
为了实现层次聚类和绘制树状图,我们将使用以下一些方法:
- 层次和凝聚聚类的功能由层次模块提供。
- 为了执行层次聚类,使用scipy.cluster.hierarchy.linkage函数。这个函数的参数是:
Syntax: scipy.cluster.hierarchy.linkage(ndarray , method , metric , optimal_ordering)
- 要将层次聚类绘制为树状图,请使用scipy.cluster.hierarchy.dendrogram函数。
Syntax: scipy.cluster.hierarchy.dendrogram(Z , p , truncate_mode , color_threshold , get_leaves , orientation , labels , count_sort , distance_sort , show_leaf_counts , no_plot , no_labels , leaf_font_size , leaf_rotation , leaf_label_func , show_contracted , link_color_func , ax , above_threshold_color)
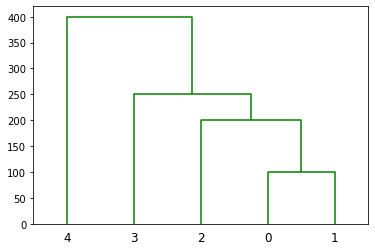
示例 1:正常树状图
Python
# Python program to plot the hierarchical
# clustering dendrogram using SciPy

# Import the python libraries
import numpy as np
from scipy.cluster import hierarchy
import matplotlib.pyplot as plt

# Create an array
x = np.array([100., 200., 300., 400., 500., 250.,
              450., 280., 450., 750.])

# Plot the hierarchical clustering as a dendrogram.
temp = hierarchy.linkage(x, 'single')
plt.figure()

dn = hierarchy.dendrogram(
    temp, above_threshold_color="green", color_threshold=.7)
Python
# Plot the dendrogram in horizontal orientation

# Import the python libraries
import numpy as np
from scipy.cluster import hierarchy
import matplotlib.pyplot as plt

# Create an array
x = np.array([100., 200., 300., 400., 500., 250.,
              450., 280., 450., 750.])

# Plot the hierarchical clustering as a dendrogram.
temp = hierarchy.linkage(x, 'single')
plt.figure()
dn = hierarchy.dendrogram(
    temp, above_threshold_color="green", color_threshold=.7, orientation='right')
输出:
示例 2:使用水平方向的树状图:
Python
# Plot the dendrogram in horizontal orientation

# Import the python libraries
import numpy as np
from scipy.cluster import hierarchy
import matplotlib.pyplot as plt

# Create an array
x = np.array([100., 200., 300., 400., 500., 250.,
              450., 280., 450., 750.])

# Plot the hierarchical clustering as a dendrogram.
temp = hierarchy.linkage(x, 'single')
plt.figure()
dn = hierarchy.dendrogram(
    temp, above_threshold_color="green", color_threshold=.7, orientation='right')
输出:
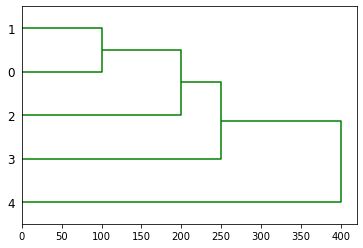
scipy.cluster.hierarchy.dendrogram 的参数方向已设置为'right' 。它在右侧绘制根,并绘制向左的后代链接。