减少 R 中绘图周围的空间
在本文中,我们将讨论如何使用 R 编程语言的基本函数来减少绘图周围的空间。
为了减少绘图周围的空间,用户只需要简单地调用 R 编程语言的内置函数par函数,然后根据用户的需要将特定参数传递给该函数,进一步这个过程将导致减少地块周围空间的结果。
Par()函数可用于设置或查询图形参数。参数可以通过将它们指定为 tag = value 形式的参数来设置,或者通过将它们作为标记值列表绕过它们。
Syntax: par(…, no.readonly = FALSE)
Parameters:
- … :-arguments in tag = value form, or a list of tagged values. The tags must come from the names of graphical parameters described in the ‘Graphical Parameters’ section.
- no.readonly:-logical; if TRUE and there are no other arguments, only parameters are returned which can be set by a subsequent par() call on the same device.
让我们先看一下初始图,这样差异就很明显了。
示例:初始图
R
x<-c(8,6,5,1,8,9,6,4)
barplot(x)
R
x<-c(8,6,5,1,8,9,6,4)

par(mar = c(4, 4, 0.1, 0.1))

barplot(x)
R
x<-c(8,6,5,1,8,9,6,4)

par(mfrow = c(2, 2))

barplot(x)
barplot(x)
barplot(x)
barplot(x)
R
x<-c(8,6,5,1,8,9,6,4)

par(mfrow = c(2, 2))
par(mar = c(4, 4, 0.1, 0.1))

barplot(x)
barplot(x)
barplot(x)
barplot(x)
输出:

现在让我们使用 par()函数减少绘图周围的空间。
示例:减少地块周围的空间
电阻
x<-c(8,6,5,1,8,9,6,4)

par(mar = c(4, 4, 0.1, 0.1))

barplot(x)
输出:

现在只是一个图,一个带有多个其他图的图也可以由单个函数管理。让我们首先看一下初始图,以便差异很明显。
示例:默认绘图
电阻
x<-c(8,6,5,1,8,9,6,4)

par(mfrow = c(2, 2))

barplot(x)
barplot(x)
barplot(x)
barplot(x)
输出:

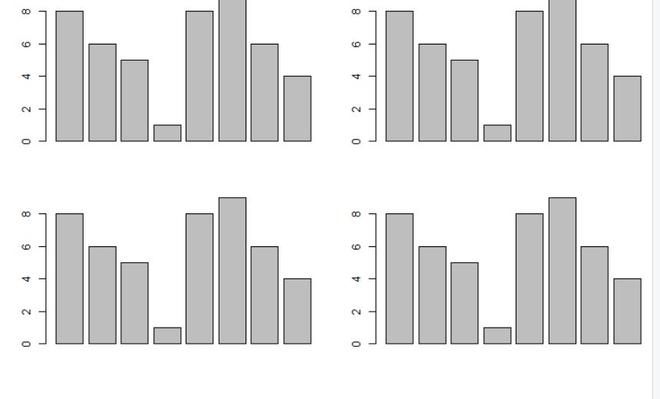
现在让我们使用 par()函数减少绘图周围的空间。
示例:缩小地块周围的空间
电阻
x<-c(8,6,5,1,8,9,6,4)

par(mfrow = c(2, 2))
par(mar = c(4, 4, 0.1, 0.1))

barplot(x)
barplot(x)
barplot(x)
barplot(x)
输出:
