R 编程中的 tidyr 包
R 语言中的包是 R 函数、编译代码和示例数据的集合。它们存储在R 环境中名为“库”的目录下。默认情况下,R 在安装过程中会安装一组包。 R 中最重要的包之一是tidyr包。 tidyr包的唯一目的是简化创建整洁数据的过程。 Tidy data 描述了一种存储数据的标准方法,该方法在整个tidyverse中尽可能使用。如果您曾经确保您的数据是整洁的,那么您将花费更少的时间来处理这些工具,而将更多的时间用于您的分析。
安装
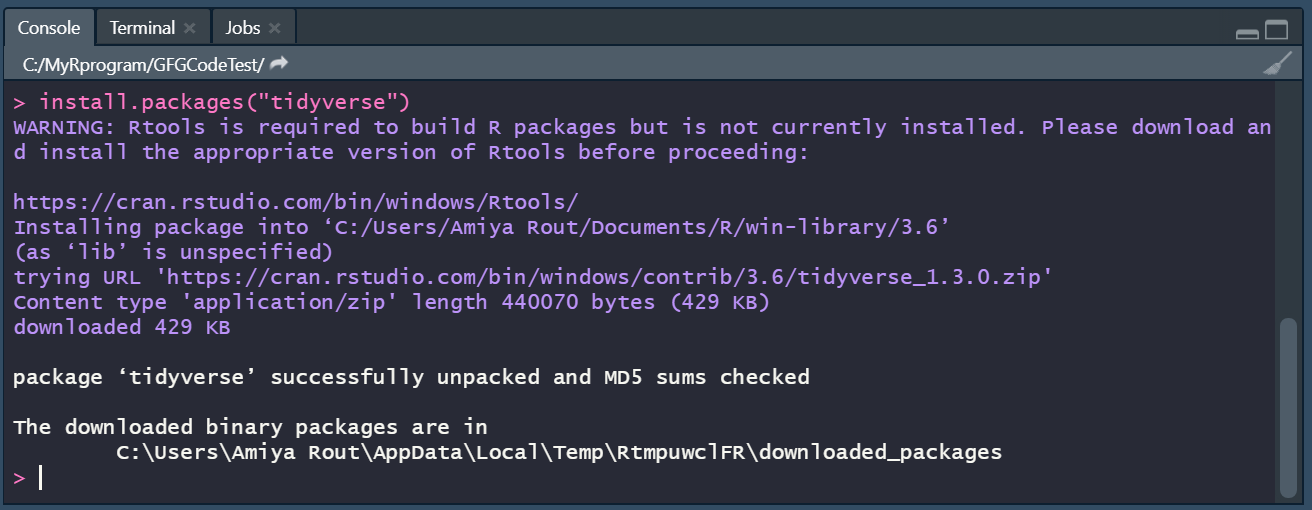
要在 R 编程中使用包,必须首先安装包。可以使用命令install.packages(“packagename”)完成此任务。要安装整个tidyverse包,请输入:
install.packages("tidyverse")
或者,要安装tidyr包,请输入:
install.packages("tidyr")
要从 GitHub 安装开发版本,请键入:
# install.packages("devtools")
devtools::install_github("tidyverse/tidyr")
tidyr 包中的重要动词函数
数据集:
在进入重要的动词函数之前,让我们先准备数据集。定义一个数据集tidy_dataframe ,其中包含有关特定组中人员频率的数据。
R
# load the tidyr package
library(tidyr)

n = 10
# creating a data frame
tidy_dataframe = data.frame(
                      S.No = c(1:n),
                    Group.1 = c(23, 345, 76, 212, 88,
                                199, 72, 35, 90, 265),
                    Group.2 = c(117, 89, 66, 334, 90,
                               101, 178, 233, 45, 200),
                    Group.3 = c(29, 101, 239, 289, 176,
                                320, 89, 109, 199, 56))

# print the elements of the data frame
tidy_dataframe
R
# using gather() function on tidy_dataframe
long <- tidy_dataframe %>%
            gather(Group, Frequency,
                   Group.1:Group.3)

# print the data frame in a long format
long
R
# import tidyr package
library(tidyr)
long <- tidy_dataframe %>%
            gather(Group, Frequency,
                   Group.1:Group.3)

# use separate() function to make data wider
separate_data <- long %>%
            separate(Group, c("Allotment",
                              "Number"))

# print the wider format
separate_data
R
# import tidyr package
library(tidyr)

long <- tidy_dataframe %>%
            gather(Group, Frequency,
                   Group.1:Group.3)

# use separate() function to make data wider
separate_data <- long %>%
            separate(Group, c("Allotment",
                              "Number"))

# use unite() function to glue
# Allotment and Number columns
unite_data <- separate_data %>%
            unite(Group, Allotment,
                  Number, sep = ".")

# print the new data frame
unite_data
R
# import tidyr package
library(tidyr)

long <- tidy_dataframe %>%
            gather(Group, Frequency,
                   Group.1:Group.3)

# use separate() function to make data wider
separate_data <- long %>%
            separate(Group, c("Allotment",
                              "Number"))

# use unite() function to glue
# Allotment and Number columns
unite_data <- separate_data %>%
            unite(Group, Allotment,
                  Number, sep = ".")

# use unite() function to make data wider
back_to_wide <- unite_data %>%
            spread(Group, Frequency)

# print the new data frame
back_to_wide
R
# import tidyr package
library(tidyr)

df <- tidy_dataframe

# nest column Group.1 in
# tidy_dataframe using nest()
df %>% nest(data = c(Group.1))
R
# import the tidyr package
library(tidyr)

df <- iris
names(iris)

# nesting the species column in
# the df data frame using nest()
head(df %>% nest(data = c(Species)))  # Output (i)

# unnesting the species column
# in the df data frame using unnest()
head(df %>% unnest(Species,.drop = NA,
                   .preserve = NULL)) # Output (ii)
R
# import the tidyr package
df <- data.frame(Month = 1:6,
                 Year = c(2000, rep(NA, 5)))

# print the df data frame
df                   # Output (i)

# use fill() to fill missing values in
# Year column in df data frame
df %>% fill(Year)    # Output (ii)
R
# import the tidyr package
library(tidyr)

# creating a numeric vector
num_vec <- c(1, 7, 9, 14, 19, 20)

# use full_seq() to fill missing
# values in num_vec
full_seq(num_vector, 1)
R
# import tidyr package
library(tidyr)

# create a tibble df with missing values
df <- tibble(S.No = c(1:10),
             Name = c('John', 'Smith', 'Peter',
                      'Luke', 'King', rep(NA, 5)))

# print df tibble
df                    # Output (i)

# use drop_na() to drop columns
# in df with missing values
df %>% drop_na(Name)  # Output (ii)
R
# import tidyr package
library(tidyr)

df <- data.frame(S.No = c(1:10),
                 Name = c('John', 'Smith',
                          'Peter', 'Luke',
                          'King', rep(NA, 5)))

df                                      # Output (i)

# use replace_na() to replace missing values or na
df %>% replace_na(list(Name = 'Henry')) # Output (ii)
输出:
S.No Group.1 Group.2 Group.3
1     1      23     117      29
2     2     345      89     101
3     3      76      66     239
4     4     212     334     289
5     5      88      90     176
6     6     199     101     320
7     7      72     178      89
8     8      35     233     109
9     9      90      45     199
10   10     265     200      56
tidyr 包提供了可用于数据清洗的各种重要功能。那些是:
- 收集()函数:它需要多列并将它们收集成键值对。基本上它使“宽”数据更长。 gather()函数将获取多个列并将它们折叠成键值对,并根据需要复制所有其他列。
Syntax:
gather(data, key = “key”, value = “value”, …, na.rm = FALSE, convert = FALSE, factor_key = FALSE)
Parameter | Description |
| data | the data frame. |
| key, value | the names of new key and value columns, as strings or as symbols. |
| ……. | the selection of columns. If left empty, all variables are selected. You can supply bare variable names, select all variables between x and z with x:z, exclude y with -y. |
| na.rm | if set TRUE, it will remove rows from output where the value column is NA. |
| convert | is set TRUE, it will automatically run type.convert() on the key column. This is useful if the column types are actually numeric, integer, or logical. |
| factor_key | if FALSE, the default, the key values will be stored as a character vector. If TRUE, will be stored as a factor, which preserves the original ordering of the columns. |
例子:
现在为了更好地理解,我们将使用collect()函数使我们的数据变长。
R
# using gather() function on tidy_dataframe
long <- tidy_dataframe %>%
            gather(Group, Frequency,
                   Group.1:Group.3)

# print the data frame in a long format
long
输出:
S.No  Group   Frequency
1     1 Group.1        23
2     2 Group.1       345
3     3 Group.1        76
4     4 Group.1       212
5     5 Group.1        88
6     6 Group.1       199
7     7 Group.1        72
8     8 Group.1        35
9     9 Group.1        90
10   10 Group.1       265
11    1 Group.2       117
12    2 Group.2        89
13    3 Group.2        66
14    4 Group.2       334
15    5 Group.2        90
16    6 Group.2       101
17    7 Group.2       178
18    8 Group.2       233
19    9 Group.2        45
20   10 Group.2       200
21    1 Group.3        29
22    2 Group.3       101
23    3 Group.3       239
24    4 Group.3       289
25    5 Group.3       176
26    6 Group.3       320
27    7 Group.3        89
28    8 Group.3       109
29    9 Group.3       199
30   10 Group.3        56
- 单独()函数:它将较长的数据转换为更广泛的格式。 separate()函数将单个字符列转换为多列。
Syntax:
separate(data, col, into, sep = ” “, remove = TRUE, convert = FALSE)
Parameter | Description |
| data | A data frame. |
| col | Column name or position. |
| into | Names of new variables to create as character vector. Use NA to omit the variable in the output. |
| sep | The separator between the columns. |
| remove | If set TRUE, it will remove input column from the output data frame. |
| convert | If TRUE, will run type.convert() with as.is = TRUE on new columns. |
例子:
我们可以说使用gather()创建的长数据集适合使用,但我们可以使用separate()进一步分解Group 变量。
R
# import tidyr package
library(tidyr)
long <- tidy_dataframe %>%
            gather(Group, Frequency,
                   Group.1:Group.3)

# use separate() function to make data wider
separate_data <- long %>%
            separate(Group, c("Allotment",
                              "Number"))

# print the wider format
separate_data
输出:
S.No Allotment Number Frequency
1     1     Group      1        23
2     2     Group      1       345
3     3     Group      1        76
4     4     Group      1       212
5     5     Group      1        88
6     6     Group      1       199
7     7     Group      1        72
8     8     Group      1        35
9     9     Group      1        90
10   10     Group      1       265
11    1     Group      2       117
12    2     Group      2        89
13    3     Group      2        66
14    4     Group      2       334
15    5     Group      2        90
16    6     Group      2       101
17    7     Group      2       178
18    8     Group      2       233
19    9     Group      2        45
20   10     Group      2       200
21    1     Group      3        29
22    2     Group      3       101
23    3     Group      3       239
24    4     Group      3       289
25    5     Group      3       176
26    6     Group      3       320
27    7     Group      3        89
28    8     Group      3       109
29    9     Group      3       199
30   10     Group      3        56
- unity()函数:它将两列合并为一列。 unite()函数是一种方便的函数,可以将多个变量值粘贴到一个中。本质上,它将单个观察的两个变量组合成一个变量。
Syntax:
unite(data, col, …, sep = “_”, remove = TRUE)
| Parameter | Description |
| data | A data frame. |
| col | The name of the new column. |
| …. | A selection of desired columns. If empty, all variables are selected. |
| sep | A separator to use between values. |
| remove | If TRUE, remove input columns from output data frame. |
例子:
团结是分开的恭维。要撤消separate() ,我们可以使用unite() ,它将两个变量合并为一个。在这里,我们将使用分隔符“。”合并两列 Group 和 Number。 .
R
# import tidyr package
library(tidyr)

long <- tidy_dataframe %>%
            gather(Group, Frequency,
                   Group.1:Group.3)

# use separate() function to make data wider
separate_data <- long %>%
            separate(Group, c("Allotment",
                              "Number"))

# use unite() function to glue
# Allotment and Number columns
unite_data <- separate_data %>%
            unite(Group, Allotment,
                  Number, sep = ".")

# print the new data frame
unite_data
输出:
S.No   Group Frequency
1     1 Group.1        23
2     2 Group.1       345
3     3 Group.1        76
4     4 Group.1       212
5     5 Group.1        88
6     6 Group.1       199
7     7 Group.1        72
8     8 Group.1        35
9     9 Group.1        90
10   10 Group.1       265
11    1 Group.2       117
12    2 Group.2        89
13    3 Group.2        66
14    4 Group.2       334
15    5 Group.2        90
16    6 Group.2       101
17    7 Group.2       178
18    8 Group.2       233
19    9 Group.2        45
20   10 Group.2       200
21    1 Group.3        29
22    2 Group.3       101
23    3 Group.3       239
24    4 Group.3       289
25    5 Group.3       176
26    6 Group.3       320
27    7 Group.3        89
28    8 Group.3       109
29    9 Group.3       199
30   10 Group.3        56
- spread()函数:它有助于将较长的格式重塑为更宽的格式。 spread()函数将键值对分布在多个列中。
Syntax:
spread(data, key, value, fill = NA, convert = FALSE)
| Parameter | Description |
| data | A data frame. |
| key | Column names or positions. |
| value | Column names or positions. |
| fill | If set, missing values will be replaced with this value. |
| convert | If TRUE, type.convert() with asis = TRUE will be run on each of the new columns. |
例子:
我们可以使用spread()函数将数据从 long 转换回 Wide。
R
# import tidyr package
library(tidyr)

long <- tidy_dataframe %>%
            gather(Group, Frequency,
                   Group.1:Group.3)

# use separate() function to make data wider
separate_data <- long %>%
            separate(Group, c("Allotment",
                              "Number"))

# use unite() function to glue
# Allotment and Number columns
unite_data <- separate_data %>%
            unite(Group, Allotment,
                  Number, sep = ".")

# use unite() function to make data wider
back_to_wide <- unite_data %>%
            spread(Group, Frequency)

# print the new data frame
back_to_wide
输出:
S.No Group.1 Group.2 Group.3
1     1      23     117      29
2     2     345      89     101
3     3      76      66     239
4     4     212     334     289
5     5      88      90     176
6     6     199     101     320
7     7      72     178      89
8     8      35     233     109
9     9      90      45     199
10   10     265     200      56
- nest()函数:它创建一个包含所有嵌套变量的数据框列表。嵌套隐含地是一种汇总操作。这与其他适用于整个数据集的摘要(尤其是模型)结合使用非常有用。
Syntax: nest(data, …, .key = “data”)
| Parameter | Description |
| data | A data frame. |
| …. | A selection of columns. If empty, all variables are selected. |
| .key | The name of the new column, as a string or symbol. |
示例:让我们尝试从我们在数据集中创建的 tidy_dataframe 嵌套 Group.2 列。
R
# import tidyr package
library(tidyr)

df <- tidy_dataframe

# nest column Group.1 in
# tidy_dataframe using nest()
df %>% nest(data = c(Group.1))
输出:
# A tibble: 10 x 4
    S.No Group.1 Group.3 data

 1     1      23      29
 2     2     345     101
 3     3      76     239
 4     4     212     289
 5     5      88     176
 6     6     199     320
 7     7      72      89
 8     8      35     109
 9     9      90     199
10    10     265      56
- unnest()函数:它基本上反转了嵌套操作。它使列表的每个元素成为自己的行。它可以处理包含原子向量、列表或数据帧(但不能混合不同类型)的列表列。
Syntax:
unnest(data, …, .drop = NA, .id = NULL, .sep = NULL, .preserve = NULL)
| Parameter | Description |
| data | A data frame |
| …. | Specification of columns to unnest. If omitted, defaults to all list-columns. |
| .drop | Should additional list columns be dropped? By default, it will drop them if unnesting the specified columns requires the rows to be duplicated. |
| .id | Data frame identifier. |
| .sep | If non-NULL, the names of unnested data frame columns will combine the name of the original list-col with the names from nested data frame, separated by .sep. |
| .preserve | List-columns to preserve in the output. These will be duplicated in the same way as atomic vectors. |
例子:
我们将尝试在 tidyr 包的 iris 数据框中嵌套和取消嵌套 Species 列。
R
# import the tidyr package
library(tidyr)

df <- iris
names(iris)

# nesting the species column in
# the df data frame using nest()
head(df %>% nest(data = c(Species)))  # Output (i)

# unnesting the species column
# in the df data frame using unnest()
head(df %>% unnest(Species,.drop = NA,
                   .preserve = NULL)) # Output (ii)
输出(一):
# A tibble: 6 x 5
  Sepal.Length Sepal.Width Petal.Length Petal.Width data

1          5.1         3.5          1.4         0.2
2          4.9         3            1.4         0.2
3          4.7         3.2          1.3         0.2
4          4.6         3.1          1.5         0.2
5          5           3.6          1.4         0.2
6          5.4         3.9          1.7         0.4
输出(ii):
# A tibble: 6 x 5
  Sepal.Length Sepal.Width Petal.Length Petal.Width Species

1          5.1         3.5          1.4         0.2 setosa
2          4.9         3            1.4         0.2 setosa
3          4.7         3.2          1.3         0.2 setosa
4          4.6         3.1          1.5         0.2 setosa
5          5           3.6          1.4         0.2 setosa
6          5.4         3.9          1.7         0.4 setosa
- fill()函数:用于使用上一个条目填充选定列中的缺失值。这在值不重复的常见输出格式中很有用,每次更改时都会记录它们。缺失值在原子向量中被替换; NULL 在列表中被替换。
Syntax:
fill(data, …, .direction = c(“down”, “up”))
| Parameter | Description |
| data | A data frame. |
| …. | A selection of columns. If empty, nothing happens. |
| direction | Direction in which to fill missing values. Currently, either “down” (the default) or “up” |
例子:
R
# import the tidyr package
df <- data.frame(Month = 1:6,
                 Year = c(2000, rep(NA, 5)))

# print the df data frame
df                   # Output (i)

# use fill() to fill missing values in
# Year column in df data frame
df %>% fill(Year)    # Output (ii)
输出(一):
Month Year
1     1 2000
2     2   NA
3     3   NA
4     4   NA
5     5   NA
6     6   NA
输出(ii):
Month Year
1     1 2000
2     2 2000
3     3 2000
4     4 2000
5     5 2000
6     6 2000
- full_seq()函数:它基本上填充了向量中应该观察到但没有观察到的缺失值。向量应该是数字。
Syntax: full_seq(x, period, tol = 1e-06)
| Parameter | Description |
| x | A numeric vector. |
| period | Gap between each observation. |
| tol | Numerical tolerance for checking periodicity. |
例子:
R
# import the tidyr package
library(tidyr)

# creating a numeric vector
num_vec <- c(1, 7, 9, 14, 19, 20)

# use full_seq() to fill missing
# values in num_vec
full_seq(num_vector, 1)
输出:
[1] 1 2 3 4 5 6 7 8 9 10 11 12 13 14 15 16 17 18 19 20
- drop_na()函数:此函数删除包含缺失值的行。
Syntax: drop_na(data, …)
| Parameter | Description |
| data | A data frame. |
| …. | A selection of columns. If empty, all variables are selected. |
例子:
R
# import tidyr package
library(tidyr)

# create a tibble df with missing values
df <- tibble(S.No = c(1:10),
             Name = c('John', 'Smith', 'Peter',
                      'Luke', 'King', rep(NA, 5)))

# print df tibble
df                    # Output (i)

# use drop_na() to drop columns
# in df with missing values
df %>% drop_na(Name)  # Output (ii)
输出(一):
# A tibble: 10 x 2
    S.No Name

 1     1 John
 2     2 Smith
 3     3 Peter
 4     4 Luke
 5     5 King
 6     6
 7     7
 8     8
 9     9
10    10
输出(ii):
# A tibble: 5 x 2
   S.No Name

1     1 John
2     2 Smith
3     3 Peter
4     4 Luke
5     5 King
- replace_na()函数:它 替换缺失值。
Syntax: replace_na(data, replace, …)
| Parameter | Description |
| data | A data frame. |
| replace | If data is a data frame, returns a data frame. If data is a vector, returns a vector of class determined by the union of data and replace. |
例子:
R
# import tidyr package
library(tidyr)

df <- data.frame(S.No = c(1:10),
                 Name = c('John', 'Smith',
                          'Peter', 'Luke',
                          'King', rep(NA, 5)))

df                                      # Output (i)

# use replace_na() to replace missing values or na
df %>% replace_na(list(Name = 'Henry')) # Output (ii)
输出(一):
# A tibble: 10 x 2
     S.No Name

 1     1 John
 2     2 Smith
 3     3 Peter
 4     4 Luke
 5     5 King
 6     6
 7     7
 8     8
 9     9
10    10
输出(ii):
S.No  Name
1     1  John
2     2 Smith
3     3 Peter
4     4  Luke
5     5  King
6     6 Henry
7     7 Henry
8     8 Henry
9     9 Henry
10   10 Henry