R 编程中的分层箱线图
一种 boxplot是一组数值数据通过其四分位数的图形表示。箱线图是非参数的,它们显示统计总体样本的变化,而不对基础统计分布进行任何假设。箱线图中箱体不同部分之间的间距表示数据的分散程度和偏度,并显示异常值。箱线图可以垂直或水平绘制。 Boxplot 的名字来自中间的盒子。分层箱线图用于检查分类变量和数字变量之间、由第三个分类变量定义的层或组之间的关系。在比较分类变量时,分层箱线图很有用。
在 R 中的实现
在 R 编程中,可以使用R Graphics Package的boxplot()函数形成分层箱线图。
Syntax:
boxplot(formula, data = NULL, …, subset, na.action = NULL, xlab = mklab(y_var = horizontal),
ylab = mklab(y_var =!horizontal), add = FALSE, ann = !add, horizontal = FALSE, drop = FALSE,
sep = “.”, lex.order = FALSE)
boxplot(x, …, range = 1.5, width = NULL, varwidth = FALSE, notch = FALSE, outline = TRUE, names, plot = TRUE,
border = par(“fg”), col = NULL, log = “”, pars = list(boxwex = 0.8, staplewex = 0.5, outwex = 0.5),
ann = !add, horizontal = FALSE, add = FALSE, at = NULL)
Parameter | Description |
| formula | a formula. |
| data | a data.frame/list from which the variables in the formula should be taken. |
| subset | an optional vector specifying a subset of observations to be used for plotting. |
| na.action | a function which indicates what should happen when the data contain NAs. |
| xlab,ylab | x- and y-axis annotation. Can be suppressed by ann=FALSE. |
| add | logical, if true add boxplot to the current plot. |
| ann | logical indicating if axes should be annotated (by xlab and ylab). |
| horizontal | logical indicating if the boxplots should be horizontal; default FALSE means vertical boxes. |
| x | for specifying data from which the boxplots are to be produced. Either a numeric vector or a single list containing such vectors. |
| range | this determines how far the plot whiskers extend out from the box. |
| width | a vector giving the relative widths of the boxes making up the plot. |
| varwidth | if varwidth is TRUE, the boxes are drawn with widths proportional to the square-roots of the number of observations in the groups. |
| notch | if the notch is TRUE, a notch is drawn in each side of the boxes. |
| outline | if the outline is not true, the outliers are not drawn. |
| names | group labels that will be printed under each boxplot. |
| boxwex | a scale factor to be applied to all boxes. |
| staplewex | staple line width expansion, proportional to box width. |
| outwex | outlier line width expansion, proportional to box width. |
| plot | if TRUE (the default) then a boxplot is produced. Else the summaries which the boxplots are based on are returned. |
| border | an optional vector of colors for the outlines of the boxplots. |
| cols | if col is non-null it is assumed to contain colors to be used to color the bodies of the box plots. |
| logs | character indicating if x or y or both coordinates should be plotted in log scale. |
| pars | a list of (potentially many) more graphical parameters. |
| at | numeric vector giving the locations where the boxplots should be drawn, particularly when add = TRUE. |
| … | for the formula method, named arguments to be passed to the default method. |
示例 1:
要绘制分层箱线图,请使用 R 中数据集库的 mtcars 数据集。 mtcars 数据集包含来自 Motor Trend Car Road Tests 的数据。在这里,让我们将不同汽车的里程数(在这种情况下为英里/加仑)与它们所拥有的档位数量进行绘制。
R
# Import the required library
library(datasets)

# Import the dataframe
cars <- data.frame(mtcars)

# Using boxplot()
boxplot(mpg~gear, data = mtcars,
        main = "Different boxplots for number of gears.",
        xlab = "No.of gears",
        ylab = "Mileage",
        col = "orange",
        border = "brown"
)
R
# Load the dataset
LungCapData <- read.csv("LungCapData.csv", header = T)
LungCapData <- data.frame(LungCapData)
attach(LungCapData)

# Catgorise Age into groups
AgeGroups <- cut(LungCapData$Age,
                 breaks = c(0, 13, 15, 17, 25),
                 labels = c("<13", "14/15", "16/17", ">=18"))
head(LungCapData)

# BoxPlot 1
boxplot(LungCapData$LungCap~LungCapData$Smoke,
        ylab = "Capacity",
        main = "Lung Capacity of Smokers Vs Non-Smokers",
        las = 1)

# BoxPlot 2
boxplot(LungCapData$LungCap[LungCapData$Age>=18]~LungCapData$Smoke[LungCapData$Age>=18],
        ylab = "Capacity",
        main = "Lung Capacity of Smokers Vs Non-Smokers",
        las = 1)

# BoxPlot 3
boxplot(LungCapData$LungCap~LungCapData$Smoke*AgeGroups,
        ylab = "Capacity", xlab = "",
        main = "Lung Capacity of Smokers Vs Non-Smokers",
        col = c(4, 2), las = 2)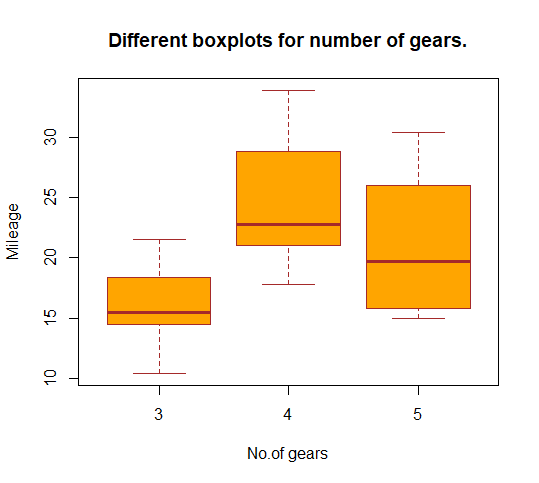
示例 2:
我们在这里使用的数据集是 LungCapData 数据集,其中包含不同年龄组吸烟者和非吸烟者的肺活量数据。数据集的结构有 6 个变量,每个变量表示肺活量、年龄、身高、吸烟(吸烟者为“是”,非吸烟者为“否”)、性别(男性/女性)和剖腹产(是/否)一个人的。我们将年龄分组,然后尝试绘制具有年龄层的吸烟者与非吸烟者肺活量的分层箱线图。请在此处下载 CSV 文件。
电阻
# Load the dataset
LungCapData <- read.csv("LungCapData.csv", header = T)
LungCapData <- data.frame(LungCapData)
attach(LungCapData)

# Catgorise Age into groups
AgeGroups <- cut(LungCapData$Age,
                 breaks = c(0, 13, 15, 17, 25),
                 labels = c("<13", "14/15", "16/17", ">=18"))
head(LungCapData)

# BoxPlot 1
boxplot(LungCapData$LungCap~LungCapData$Smoke,
        ylab = "Capacity",
        main = "Lung Capacity of Smokers Vs Non-Smokers",
        las = 1)

# BoxPlot 2
boxplot(LungCapData$LungCap[LungCapData$Age>=18]~LungCapData$Smoke[LungCapData$Age>=18],
        ylab = "Capacity",
        main = "Lung Capacity of Smokers Vs Non-Smokers",
        las = 1)

# BoxPlot 3
boxplot(LungCapData$LungCap~LungCapData$Smoke*AgeGroups,
        ylab = "Capacity", xlab = "",
        main = "Lung Capacity of Smokers Vs Non-Smokers",
        col = c(4, 2), las = 2)
输出:
# 箱线图 1
箱线图 1 绘制了吸烟者和非吸烟者的肺活量,其中 no 代表非吸烟者,yes 代表吸烟者。
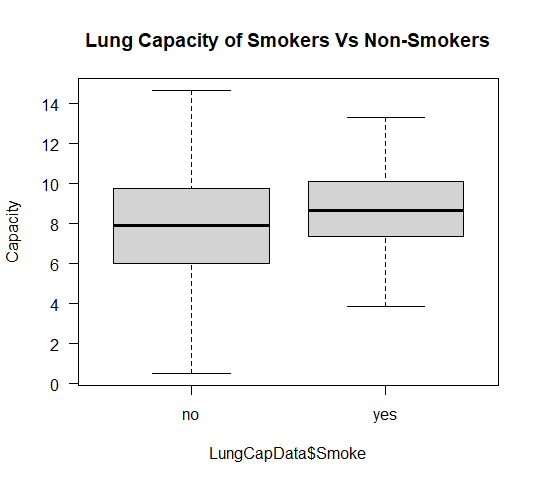
通过分析上面显示的箱线图,我们可以清楚地表明,与吸烟者相比,非吸烟者的肺活量平均而言较低。
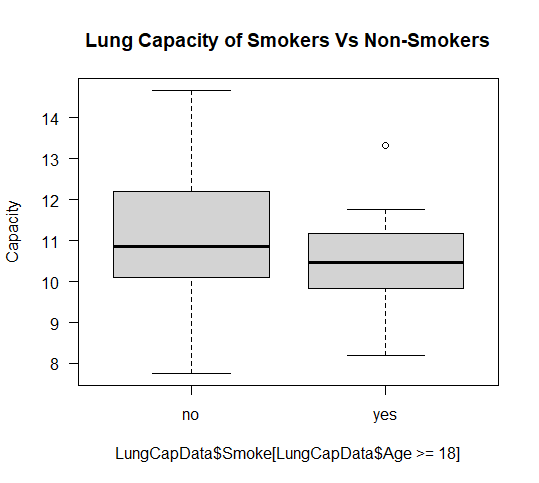
# 箱线图 2
箱线图 2 绘制了年龄大于或等于 18 岁的吸烟者和非吸烟者的肺活量,其中 no 代表非吸烟者,yes 代表吸烟者。
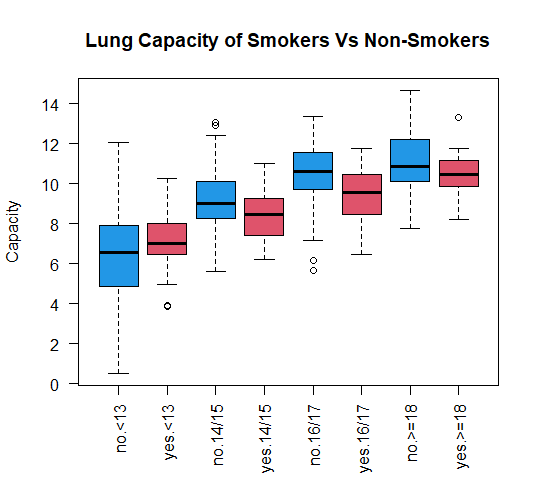
# 箱线图 3
箱线图 3 绘制了数据集中不同年龄组吸烟者和非吸烟者的肺活量,其中蓝色箱线图代表非吸烟者,红色箱线图代表吸烟者。