用Python绘制趋势图
先决条件:Matplotlib
趋势图是用于显示一段时间内的趋势数据的图表。它描述了两个变量 (x, y) 的函数表示。其中 x 是时间相关变量,而 y 是收集的数据。图形可以通过折线图、直方图、散点图、条形图和饼图以任何形式显示。在Python,我们可以使用 matplotlib.pyplot 库绘制这些趋势图。它用于为给定数据绘制图形。
任务简单明了,为了绘制任何图形,我们必须满足基本数据要求,然后确定一段时间内 x 的值以及为 y 收集的数据。绘制上述数据的图形。
下面给出了描述相同的各种实现:
示例 1:
Python3
# import all the libraries
import numpy as np
import pandas as pd
import matplotlib.pyplot as plt

# create a dataframe
Sports = {
    "medals": [100, 98, 102, 56, 78, 56, 78, 96],
    "Time_Period": [2010, 2011, 2012, 2013, 2014, 2015, 2016, 2017]
}

df = pd.DataFrame(Sports)
print(df)

# to plot the graph
df.plot(x="Time_Period", y="medals", kind="line")
plt.show()
Python3
# import all the libraries
import numpy as np
import pandas as pd
import matplotlib.pyplot as plt

# create a dataframe
Sports = {
    "medals": [100, 98, 102, 56, 78, 56,
               78, 96],

    "Time_Period": [2010, 2011, 2012, 2013,
                    2014, 2015, 2016, 2017]
}
df = pd.DataFrame(Sports)
print(df)


# to plot the graph
# subplot (rowno,columno,position) is used
# to plot in a single frame.
# to plot the scatter graph ,write kind= scatter
df.plot(x="Time_Period", y="medals", kind="scatter")
plt.title("scatter chart")
plt.subplot(1, 1, 1)


# to Plot the graph in Bar chart
df.plot(x="Time_Period", y="medals", kind="bar")
plt.title("bar")
plt.subplot(1, 1, 2)

plt.show()
Python3
# import the library
import matplotlib.pyplot as plt


# Creation of Data
x1 = ['math', 'english', 'science', 'Hindi', 'social studies']
y1 = [92, 54, 63, 75, 53]
y2 = [86, 44, 65, 98, 85]

# Plotting the Data
plt.plot(x1, y1, label='Semester1')
plt.plot(x1, y2, label='semester2')

plt.xlabel('subjects')
plt.ylabel('marks')
plt.title("marks obtained in 2010")

plt.plot(y1, 'o:g', linestyle='--', linewidth='8')
plt.plot(y2, 'o:g', linestyle=':', linewidth='8')

plt.legend()
输出:
medals  Time_Period
0     100         2010
1      98         2011
2     102         2012
3      56         2013
4      78         2014
5      56         2015
6      78         2016
7      96         2017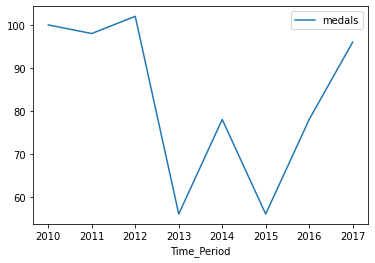
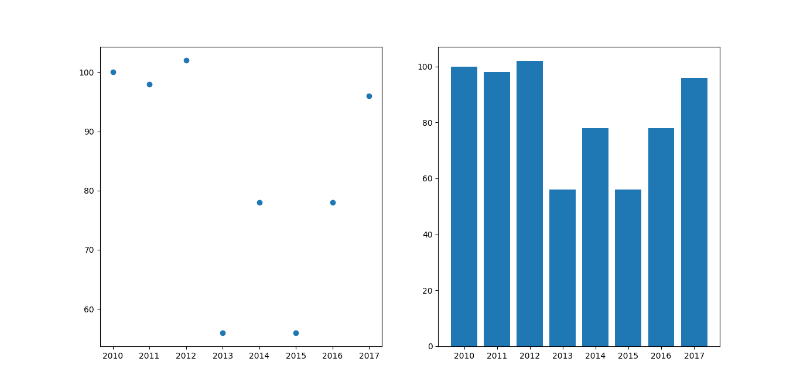
示例 2:使用上述数据,我们将绘制散点图和条形图。
蟒蛇3
# import all the libraries
import numpy as np
import pandas as pd
import matplotlib.pyplot as plt

# create a dataframe
Sports = {
    "medals": [100, 98, 102, 56, 78, 56,
               78, 96],

    "Time_Period": [2010, 2011, 2012, 2013,
                    2014, 2015, 2016, 2017]
}
df = pd.DataFrame(Sports)
print(df)


# to plot the graph
# subplot (rowno,columno,position) is used
# to plot in a single frame.
# to plot the scatter graph ,write kind= scatter
df.plot(x="Time_Period", y="medals", kind="scatter")
plt.title("scatter chart")
plt.subplot(1, 1, 1)


# to Plot the graph in Bar chart
df.plot(x="Time_Period", y="medals", kind="bar")
plt.title("bar")
plt.subplot(1, 1, 2)

plt.show()
输出:
示例 3 :学生在 2010 年获得分数。
蟒蛇3
# import the library
import matplotlib.pyplot as plt


# Creation of Data
x1 = ['math', 'english', 'science', 'Hindi', 'social studies']
y1 = [92, 54, 63, 75, 53]
y2 = [86, 44, 65, 98, 85]

# Plotting the Data
plt.plot(x1, y1, label='Semester1')
plt.plot(x1, y2, label='semester2')

plt.xlabel('subjects')
plt.ylabel('marks')
plt.title("marks obtained in 2010")

plt.plot(y1, 'o:g', linestyle='--', linewidth='8')
plt.plot(y2, 'o:g', linestyle=':', linewidth='8')

plt.legend()
输出:
