从 Pandas 系列创建数据框
Series 是 pandas 中的一种列表类型,可以采用整数值、字符串值、双精度值等。但是在 Pandas Series 中,我们以列表的形式返回一个对象,索引从0到n ,其中n是系列值的长度。
在本文后面,我们将讨论 pandas 中的数据帧,但我们首先需要了解 Series 和 Dataframe 之间的主要区别。系列只能包含带有索引的单个列表,而数据框可以由多个系列组成,或者我们可以说数据框是可用于分析数据的系列的集合。
代码 #1:创建一个简单的系列
import pandas as pd
import matplotlib.pyplot as plt

author = ['Jitender', 'Purnima', 'Arpit', 'Jyoti']

auth_series = pd.Series(author)
print(auth_series)
输出:
0    Jitender
1     Purnima
2       Arpit
3       Jyoti
dtype: object
让我们检查系列的类型:
import pandas as pd
import matplotlib.pyplot as plt

author = ['Jitender', 'Purnima', 'Arpit', 'Jyoti']

auth_series = pd.Series(author)
print(type(auth_series))
输出:
代码 #2:从系列创建数据框
import pandas as pd
import matplotlib.pyplot as plt

author = ['Jitender', 'Purnima', 'Arpit', 'Jyoti']
article = [210, 211, 114, 178]

auth_series = pd.Series(author)
article_series = pd.Series(article)

frame = { 'Author': auth_series, 'Article': article_series }

result = pd.DataFrame(frame)

print(result)
输出:
Author  Article
0  Jitender      210
1   Purnima      211
2     Arpit      114
3     Jyoti      178
解释:
我们正在结合两个系列作者和文章发表。创建一个字典,以便我们可以组合系列的元数据。元数据是可以定义一系列值的数据的数据。将此字典传递给pandas DataFrame,最后您可以看到两个系列的组合,即作者和文章数量。代码 #3:如何在数据框中从外部添加系列
import pandas as pd
import matplotlib.pyplot as plt

author = ['Jitender', 'Purnima', 'Arpit', 'Jyoti']
article = [210, 211, 114, 178]

auth_series = pd.Series(author)
article_series = pd.Series(article)

frame = { 'Author': auth_series, 'Article': article_series }

result = pd.DataFrame(frame)
age = [21, 21, 24, 23]

result['Age'] = pd.Series(age)

print(result)
输出:
Author  Article  Age
0  Jitender      210   21
1   Purnima      211   21
2     Arpit      114   24
3     Jyoti      178   23
解释:
我们又添加了一个外部命名为作者年龄的系列,然后直接在 pandas 数据框中添加了这个系列。记住一件事,如果缺少任何值,那么默认情况下它将被转换为NaN值,即默认情况下为null 。代码 #4:数据框中的缺失值
import pandas as pd
import matplotlib.pyplot as plt

author = ['Jitender', 'Purnima', 'Arpit', 'Jyoti']
article = [210, 211, 114, 178]

auth_series = pd.Series(author)
article_series = pd.Series(article)

frame = { 'Author': auth_series, 'Article': article_series }

result = pd.DataFrame(frame)
age = [21, 21, 23]

result['Age'] = pd.Series(age)

print(result)
输出:
Author  Article   Age
0  Jitender      210  21.0
1   Purnima      211  21.0
2     Arpit      114  23.0
3     Jyoti      178   NaN
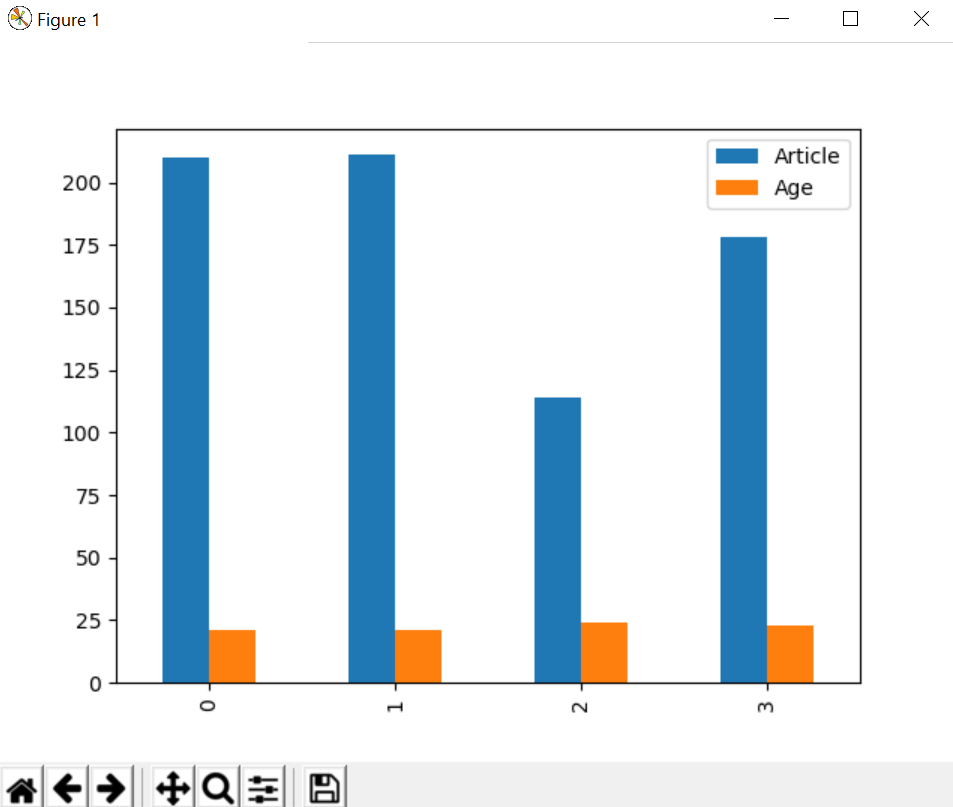
代码 #5:图表上的数据图
使用plot.bar()我们创建了一个条形图。
import pandas as pd
import matplotlib.pyplot as plt

author = ['Jitender', 'Purnima', 'Arpit', 'Jyoti']
article = [210, 211, 114, 178]

auth_series = pd.Series(author)
article_series = pd.Series(article)

frame = { 'Author': auth_series, 'Article': article_series }

result = pd.DataFrame(frame)
age = [21, 21, 24, 23]

result['Age'] = pd.Series(age)

result.plot.bar()
plt.show()
输出: