在微积分领域中,图是非常必要的,很多时候,做很多事情或了解函数的行为会更容易。可以使用图形轻松地确定任何方程式的性质,例如,取决于方程式是什么,可以回答该图形是否是抛物线形,双曲线形,椭圆形等。在绘制曲线时,需要采取多种步骤,例如查找函数的域,绘制截距等。
如何执行曲线素描?
要绘制任何给定函数的图形,需要执行一些步骤和检查。我们需要检查导数,交点,有时还要检查双导数,以找出函数的行为。有时功能是不连续的,在这种情况下,我们将不得不为每个连续的部分检查所有这些事情。下面的列表指出了我们需要检查的事情,以使您对任何函数的图形看起来都很了解。
Domain
First, analyze the function to check for its domain. We need to find out the points where the value of the function becomes undefined or is discontinuous. For example:
![]() is not defined at x = 0. Log(x) is defined only at positive values of x.
is not defined at x = 0. Log(x) is defined only at positive values of x.
Intercepts
Now after checking the domain, we will look for the points where the graph cuts the x-axis and the y-axis. This gives us a lot of idea about the shape of graphs. For finding out the x-intercept, just put y = 0 and solve the equation. Similarly, for finding out the values of the y-intercept, just put x = 0 and solve the reduced equation to get the value of y.
Symmetry
Determine whether the functions are odd, even, or neither of these. Sometimes some functions are periodic in nature. We need to check for their periodicity if they are periodic in nature. Functions satisfying, f(x) = f(-x) are called even functions. While the functions satisfying f(-x) = -f(x) are called odd functions. Some examples of periodic functions are:
Sin(x), Cos(x) and other trigonometric functions.
Maxima and Minima
Maxima and minima of the functions give us an idea about the regions where the function is increasing or decreasing. For finding out the maxima and minima in any function, we need to find the critical points. Critical points of the function are defined as the points where,
f'(x) = 0
Concavity and Convexity
Second derivative test must be used to find the points of inflection. Points of inflection occur when f”(x) = 0. The places where f”(x) < 0, that means the curve is convex upward while the places where f”(x) > 0, the curve is convex downward.
Asymptomatic Values
We also need to look the values, the function is going to take at x = ∞ or x = -∞. These values give idea about which way the graph of function will lie in the long term on larger values of x.
因此,遵循这些一般规则,我们可以为任何曲线绘制图形。让我们看一下多项式和对数函数的曲线。
草绘多项式函数
多项式函数在微积分中经常出现,因此了解如何绘制其图非常重要。我们将研究一个函数,并使用上面研究的技术来推断该函数的图。总体思路是寻找无症状值,将其移动到哪里,然后找到关键点并根据它们绘制图表。让我们通过示例来看一下
示例:为给定的函数绘制图形,
f(x)= x 2 + 4
解决方案:
We know that the domain of this function is all real numbers. This functions will tend to infinity as we go towards large positive and negative values of x.
Notice that f(-x) = (-x)2 + 4 = x2 + 4 = f(x). That is this function is even, so its graph must be symmetric about the y-axis.
Now we know that graph goes to infinity and is symmetrical around the y-axis. Now, let’s look for critical points.
f'(x) = 2x = 0
⇒ x = 0
Thus, there is only one critical point which is x = 0. Checking the double derivative f”(x) = 2. Since f”(x) > 0 for every x. So, the graph must be convex upward everywhere with minima at x = 0. Now we just need to know the value of the function at minima.
f(0) = 4.
Now we are ready to plot a graph.

绘制对数函数
我们知道对数函数是指数函数的逆函数。函数y = log b x是y = b x的逆函数。指数函数的图形如下。我们也知道,函数逆的图基本上是y = x时该图的镜像。因此,我们可以从给定的指数函数图导出对数函数图的形状。

该图的镜像为

让我们看一个图形对数函数的例子。
示例:为log 10 x + 5绘制图形。
解决方案:
We can see that the function is f(x) = log10x + 5.
The graph of this equation will be shifted 5 units in the upwards direction.

样本问题
问题1:为给定函数绘制图形,
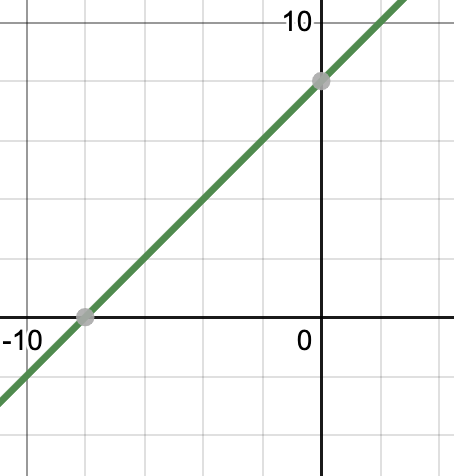
f(x)= x + 8
解决方案:
We know that the domain of this function is all real numbers. This functions will tend to infinity as we go towards large positive and negative values of x.
Now we know that graph goes to positive infinity for larger positive values of x and negative infinity for larger negative values of x.Now, let’s look for critical points.
f'(x) = 1
There is no critical point, that means derivatives change sign remains same and constant throughout.
Let’s see where the equation cuts the x-axis.
x+ 8 = 0
⇒x = -8
Now we are ready to plot a graph.

问题2:为给定函数绘制图形,
f(x)= x 2 – 6x + 8
解决方案:
We know that the domain of this function is all real numbers. This functions will tend to infinity as we go towards large positive and negative values of x.
Now we know that graph goes to positive infinity for larger positive values of x and negative infinity for larger negative values of x.Now, let’s look for critical points.
f'(x) = 2x -6 = 0
⇒x = 3
There is one critical point, that means derivatives change sign at that, but we don’t know which sign changes to what. So, we will check the sign.
From x ∈ (-∞,3] f'(x) < 0. That is in this interval, the graph is decreasing.
From x ∈ (3,∞) f'(x) > 0. That is in this interval, the graph is increasing.
That means the critical point is a minimum.
Let’s see where the equation cuts the x-axis.
x2 -6x + 8 = 0
⇒x2 -4x -2x + 8 = 0
⇒x(x – 4) -2(x – 4) = 0
⇒(x – 2)(x – 4) = 0
Now we are ready to plot a graph.

问题3:为给定函数绘制图形,
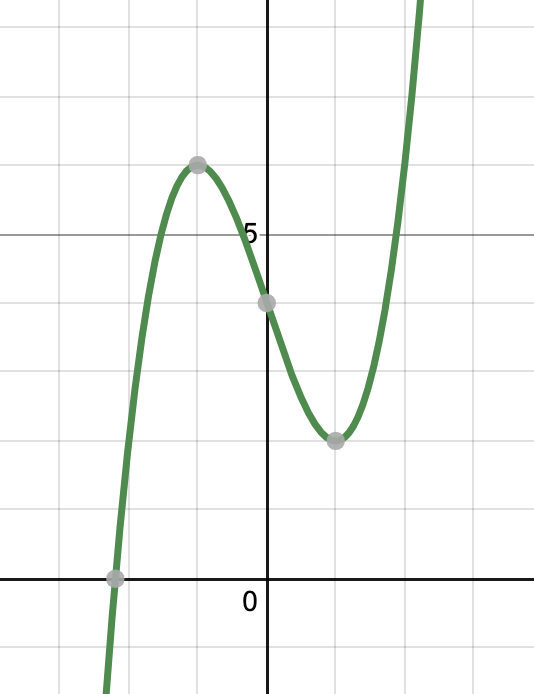
f(x)= x 3 – 3x + 4
解决方案:
We know that the domain of this function is all real numbers. This functions will tend to infinity as we go towards large positive and negative values of x.
Now we know that graph goes to positive infinity for larger positive values of x and negative infinity for larger negative values of x.Now, let’s look for critical points.
f'(x) = 3x2 -3 = 0
⇒x2 = 1
⇒x = -1 or 1
There are two critical points, that means derivatives change sign at them, but we don’t know which sign changes to what. So, we will check the sign.
From x ∈ (-∞,-1] f'(x) > 0. That is in this interval, the graph is increasing.
From x ∈ (-1,1] f'(x) < 0. That is in this interval, the graph is decreasing.
From x ∈ (1,∞) f'(x) > 0. That is in this interval, the graph is increasing.
f(0) = 4.
Now we are ready to plot a graph.

问题4:找到方程f(x)= e x + 2的图。
解决方案:
We know that f(x) = ex + 2 is an exponential function, it increases with increasing value of x.
f'(x) = ex
This will never become zero, so there are no critical points. The graph is continuously increasing.
f”(x) > 0 thus it’s shape is always convex upward. Due to the addition of 2 to the exponential function. The whole graph will be shifted two units upwards.
