对于任何两个变量,如果提及了该关系的规则,则可以通过构造值表来绘制这两个变量之间的关系。至少要知道两点的坐标才能绘制直线图。这些点必须符合规则,并且在绘制时将此类图称为线性图。
线性图
具有不间断线的线图称为线性图。要绘制实线,我们需要在图形表上找到一些点。
让我们使图具有x坐标和y坐标。
假设您去礼堂并搜索保留的座位。您需要知道两个数字,行号和座位号。这是在平面上固定点的基本方法。
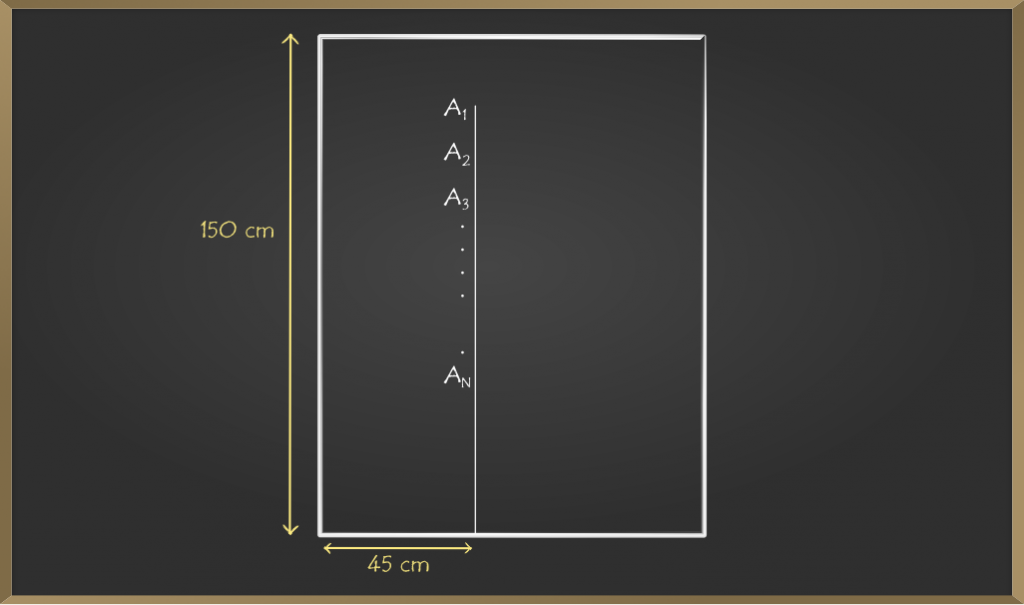
如何在板上描述位置?
在板上画一个点,即A1,A2,A3,…。,AN从板的左边缘开始测量这些点,发现该点为45厘米。现在我们可以说A1距左边缘45厘米,距底边缘150厘米。
线性图上的样本问题
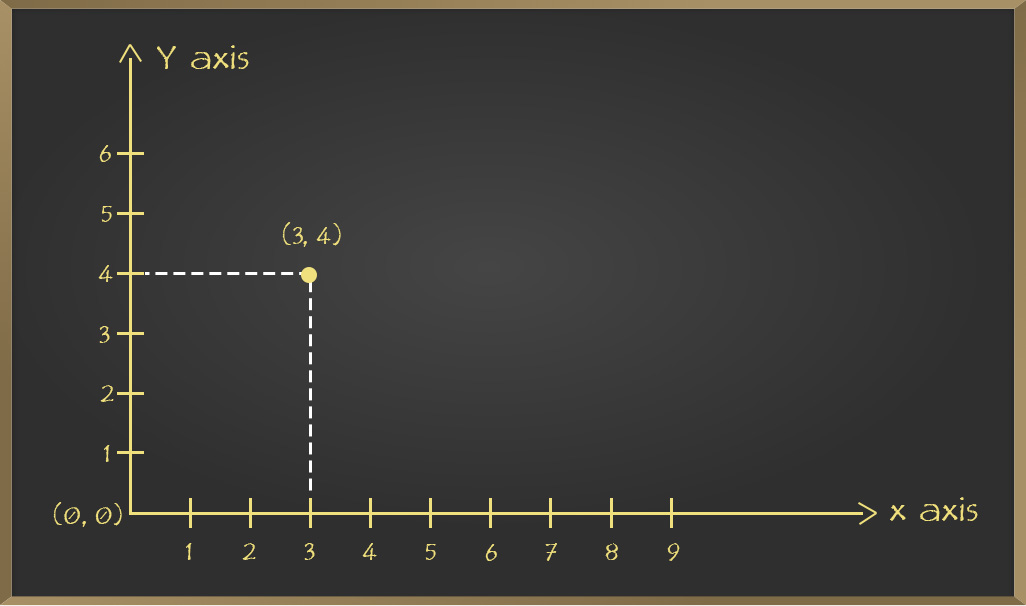
问题1:在图表上绘制(3,4)
Solution:
As in graph points are denoted in the form of (x, y)
So, on comparing the points:
x = 3 and y = 4.
First, draw x = 3 moves in the forward direction to x = 3.
Now, draw y = 4 moves in the upward direction to (3, 4).
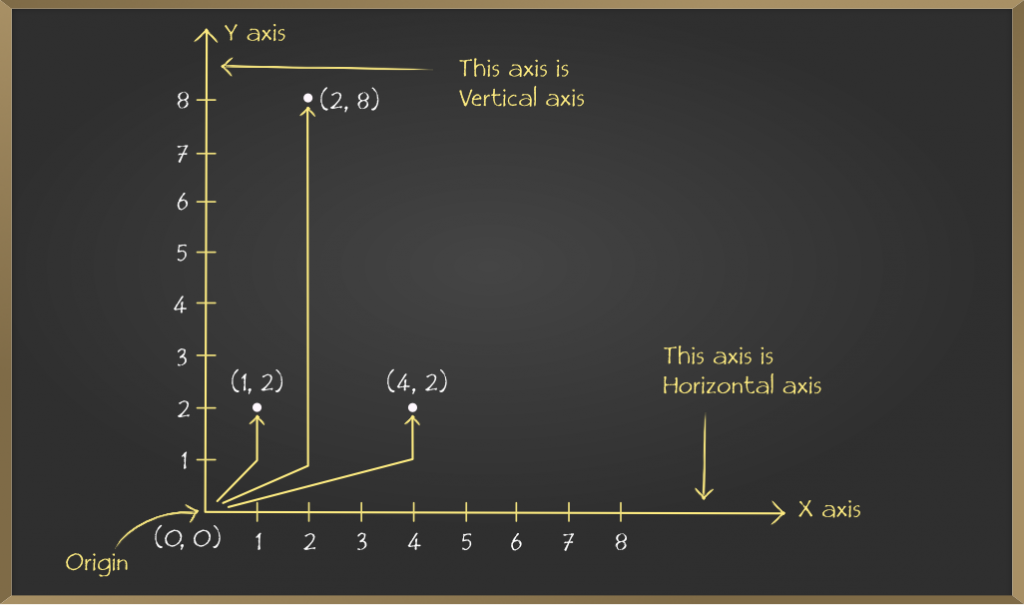
问题2:在图形上找到给定的点。
- (1、2)
- (2、8)
- (4,2)
Solution:
For x = 1 and y = 2. Starting from (0, 0) origin we move x = 1 direction forward and from there we move y = 2 direction upward then finally reaching state is our point.
Similarly, plot the rest of the two points on Graph.
问题3:绘制以下点并验证它们是否在直线上。
- (0,1),(0,2),(0,4),(0,3)
- (1,1),(2,2),(3,3),(4,4),(5,5)
Solution:
1. Plotting (0, 1), (0, 2), (0, 4), (0, 3) on graph
We can draw every coordinate on graph sheet as follows .
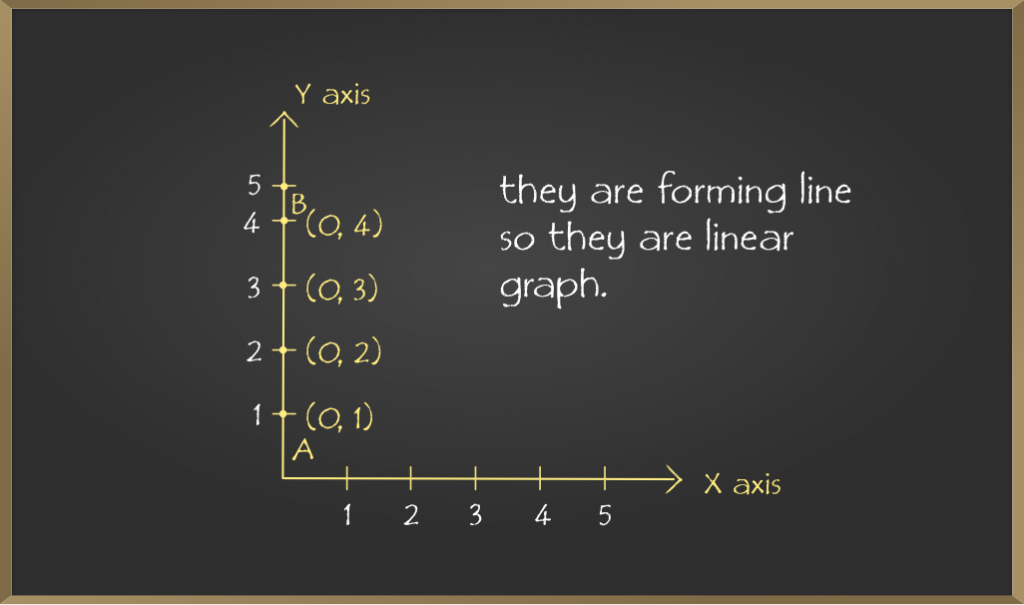
Here it forms a line after joining all the points.
2. Plotting (1, 1), (2, 2), (3, 3), (4, 4), (5, 5) on graph
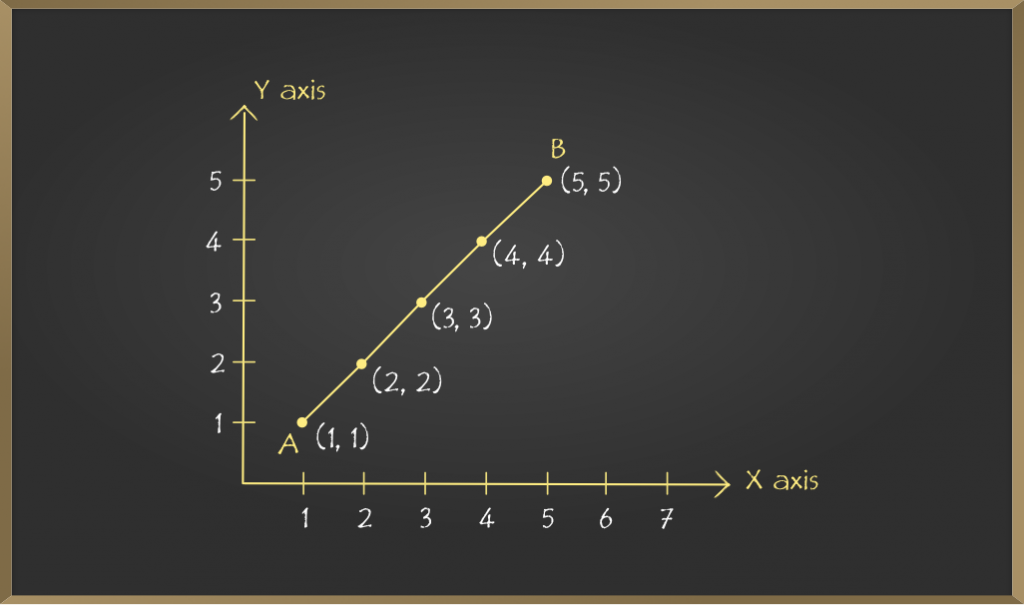
注意:在上述每种情况下,通过将绘制的点合并而获得的图形是一条线。这样的图称为线性图。
线性图的应用
在日常生活中,我们观察到不同数量价值的变化,或者我们可以说,使用该设施的次数越多,我们就必须为此付出更多的代价。例如,如果我们消耗更多的电力,那么我们将不得不支付更多的账单,反之亦然。因此,一个数量会影响另一个数量。可以说,电量是自变量,而账单量是因变量。我们可以用图表来显示这些关系。
问题1:阿米特(Amit)可以以每小时30公里的恒定速度骑自行车。绘制这种情况的时间-距离图并找到它
(i)阿米特(Amit)骑行75公里的时间。
(ii)阿米特(Amit)在3.5小时内覆盖的距离。
Solution:
The table so formed is:
| Time (in hours) | 1 | 2 | 3 | 4 |
| Distance covered (in km) | 30 | 60 | 90 | 120 |
Consider the Scale:
Horizontal: 2 units = 1 hour
Vertical: 1 unit = 10 km
Mark time on horizontal axis.
Mark distance on vertical axis
Plot points: (1, 30), (2, 60), (3, 90), (4, 120)
On joining the points the required linear graph is obtained.
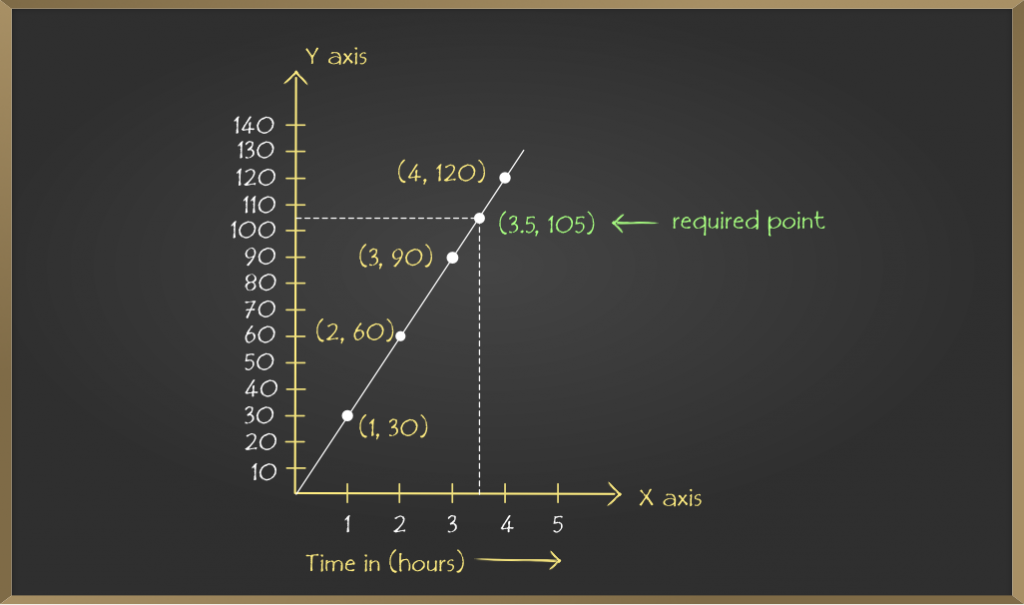
(i) From the above graph it is concluded that on the vertical axis corresponding to the distance 75 km, the time is 2.5 hours on the horizontal axis. Thus, 2.5 hours are needed to cover 75 km.
(ii) Similarly, on the horizontal axis corresponding to time 3.5 hours, the distance covered is 105 km on the vertical axis.
问题2:一家公共银行为老年人提供10%的存款利息。绘制一个图表,表示存款金额与老年人所赚取的利息之间的关系,并从绘制的图表中说明以下内容:
(i)每年450卢比的投资赚取的利息。
(ii)为赚取₹3 5.的利息而存入的金额。
| Hours of ride | Distance covered |
|
1 hour 2 hours 3 hours 4 hours |
30 km 2*30 = 60km 3*30 = 90km 4*30 =120km |
Solution:
Consider the Scale:
Horizontal: 1 unit = ₹ 10
Vertical: 1 unit = ₹ 100
Mark interest earned on horizontal axis.
Mark amount deposited on vertical axis.
Plot the points: (10, 100), (30, 300), (50, 500), (70, 700) and (90, 900) on the graph.
On joining the points the required linear graph is obtained.
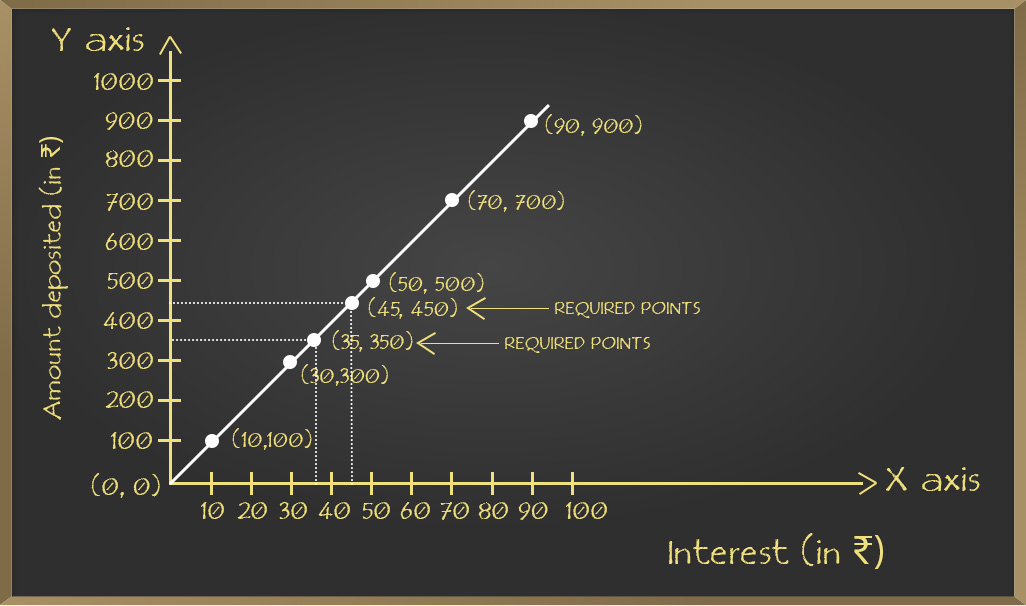
(i) From the above graph it is concluded that on the vertical axis corresponding to the amount deposited ₹ 450, the interest earned is ₹ 45 on the horizontal axis. Thus, ₹ 45 are earned on the deposit of ₹ 450.
(ii) Similarly, on the horizontal axis corresponding to interest earned 35%, the amount deposited is ₹ 350 on the vertical axis.