📌 相关文章
- Google Colab-什么是Google Colab? -指导点(1)
- Google Colab-什么是Google Colab? -指导点
- google colab 安装 python 包 (1)
- Google Colab教程
- Google Colab教程(1)
- Google Colab-简介
- Google Colab-简介(1)
- 在 google colab 上更新 python (1)
- 讨论Google Colab(1)
- 讨论Google Colab
- google colab 安装 python 包 - 任何代码示例
- Google Colab-您的第一个Colab笔记本
- Google Colab-您的第一个Colab笔记本(1)
- Google Colab-添加表单
- Google Colab-添加表单(1)
- 在 google colab 上更新 python - 任何代码示例
- 在 google colab 中添加视频 (1)
- 检查安装在 google colab 中的库 - Shell-Bash (1)
- google colab python 版本 - Python (1)
- 检查安装在 google colab 中的库 - Shell-Bash 代码示例
- google colab python 版本 - Python 代码示例
- Google Colab-保存您的工作
- Google Colab-保存您的工作(1)
- 在 google colab 上运行 selenium - Python (1)
- Google Colab-有用的资源(1)
- Google Colab-有用的资源
- 在 google colab 中添加视频 - 任何代码示例
- Google Colab-安装ML库
- Google Colab-安装ML库(1)
📜 Google Colab-图形输出
📅 最后修改于: 2020-10-16 02:36:04 🧑 作者: Mango
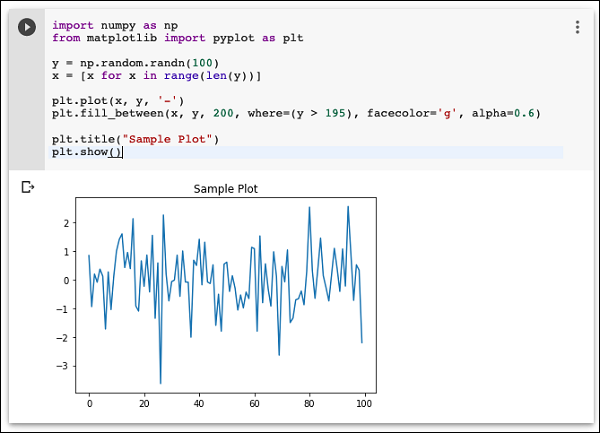
Colab还支持丰富的输出,例如图表。在“代码”单元格中键入以下代码。
import numpy as np
from matplotlib import pyplot as plt

y = np.random.randn(100)
x = [x for x in range(len(y))]

plt.plot(x, y, '-')
plt.fill_between(x, y, 200, where = (y > 195), facecolor='g', alpha=0.6)

plt.title("Sample Plot")
plt.show()
现在,如果您运行代码,您将看到以下输出-

请注意,图形输出显示在“代码”单元的“输出”部分中。同样,您将能够在整个程序代码中创建和显示几种类型的图表。
现在,当您熟悉Colab的基础知识时,让我们继续学习Colab的功能,这些功能使您的Python代码开发更加容易。