从 Matplotlib 中寻找离群点
异常值是与其他观测值不同或与其他数据相距一定距离的数据点。它们主要是由于一些实验误差而产生的,这可能会导致统计分析中的一些问题。虽然在大数据集中,很明显有些数据将远离样本均值。需要找到并明智地处理这些异常值。
我们可以根据需要使用箱线图。
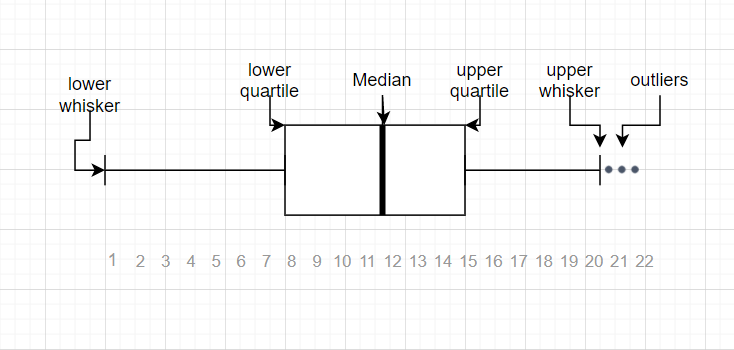
上面是一个箱线图,用于显示数据值的汇总及其中位数、第一四分位数、第三四分位数、最小值和最大值。上下须线外的数据点是异常值。在晶须的第一个和第三个四分位数之间是四分位数区域,在该区域上方有一条垂直线通过,称为中位数。有关更多详细信息,请参阅博客 Box plot using Python。以下是从箱线图中查找异常值的方法:
1.Visualizing through matplotlib boxplot using plt.boxplot().
2.Using 1.5 IQR rule.
例子:
Python3
# Adding libraries
import numpy as np
import pandas as pd
import matplotlib.pyplot as plt

# random integers between 1 to 20
arr = np.random.randint(1, 20, size=30)

# two outliers taken
arr1 = np.append(arr, [27, 30])

print('Thus the array becomes{}'.format(arr1))
Python3
plt.boxplot(arr1)
fig = plt.figure(figsize =(10, 7))
plt.show()
Python
# finding the 1st quartile
q1 = np.quantile(arr1, 0.25)

# finding the 3rd quartile
q3 = np.quantile(arr1, 0.75)
med = np.median(arr1)

# finding the iqr region
iqr = q3-q1

# finding upper and lower whiskers
upper_bound = q3+(1.5*iqr)
lower_bound = q1-(1.5*iqr)
print(iqr, upper_bound, lower_bound)
Python3
outliers = arr1[(arr1 <= lower_bound) | (arr1 >= upper_bound)]
print('The following are the outliers in the boxplot:{}'.format(outliers))
Python3
# boxplot of data within the whisker
arr2 = arr1[(arr1 >= lower_bound) & (arr1 <= upper_bound)]
plt.figure(figsize=(12, 7))
plt.boxplot(arr2)
plt.show()
输出:
array([4, 12, 15, 7, 13, 2, 12, 11, 10, 12, 15, 5, 9, 16, 17, 2, 10, 15, 4, 16, 14, 19, 12, 8, 13, 3, 16, 10, 1, 13, 27, 30])
使用 plt.boxplot() 通过 matplotlib boxplot 进行可视化
蟒蛇3
plt.boxplot(arr1)
fig = plt.figure(figsize =(10, 7))
plt.show()
输出:
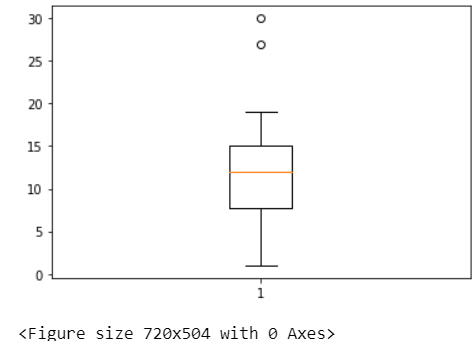
所以从上图中,我们可以看到两个异常值。
1.5 IQR 规则
1.5IQR 规则的步骤:-
- 查找中位数、四分位数和四分位数区域
- 计算低于第一个四分位数的 1.5*IQR 并检查低异常值。
- 计算高于第三个四分位数的 1.5*IQR 并检查异常值。
Python
# finding the 1st quartile
q1 = np.quantile(arr1, 0.25)

# finding the 3rd quartile
q3 = np.quantile(arr1, 0.75)
med = np.median(arr1)

# finding the iqr region
iqr = q3-q1

# finding upper and lower whiskers
upper_bound = q3+(1.5*iqr)
lower_bound = q1-(1.5*iqr)
print(iqr, upper_bound, lower_bound)
输出:
8.25 26.375 -6.625蟒蛇3
outliers = arr1[(arr1 <= lower_bound) | (arr1 >= upper_bound)]
print('The following are the outliers in the boxplot:{}'.format(outliers))
输出:
The following are the outliers in the boxplot:[27 30]因此,已使用该规则检测到异常值。现在消除它们并用数据点绘制图形 -
蟒蛇3
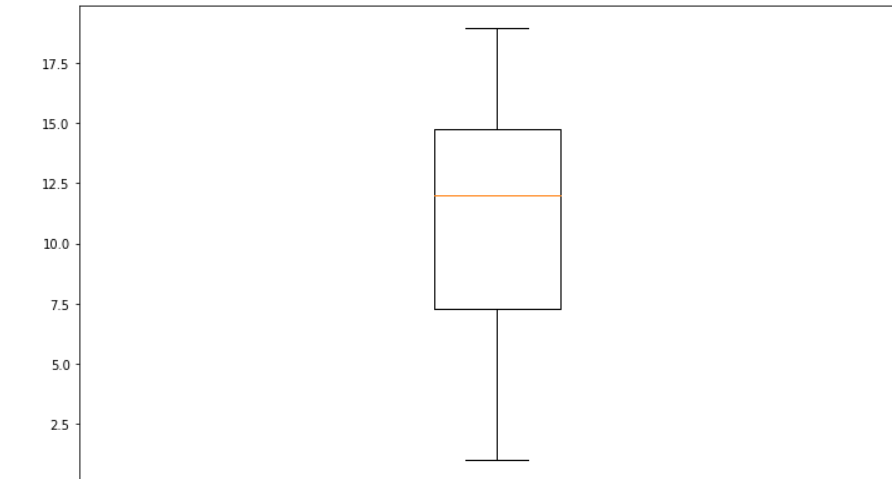
# boxplot of data within the whisker
arr2 = arr1[(arr1 >= lower_bound) & (arr1 <= upper_bound)]
plt.figure(figsize=(12, 7))
plt.boxplot(arr2)
plt.show()
输出 :