Python Seaborn – 猫图
Seaborn 是一个基于 matplotlib 的Python数据可视化库。它提供了一个高级界面,用于绘制有吸引力且信息丰富的统计图形。 Seaborn 帮助解决了 Matplotlib 面临的两大问题;问题是什么?
- 默认 Matplotlib 参数
- 使用数据框
随着 Seaborn 对 Matplotlib 的赞美和扩展,学习曲线是相当渐进的。如果您了解 Matplotlib,那么您已经完成了 Seaborn 的一半。 Seaborn 库与其他绘图库相比具有许多优势:
- 它非常易于使用并且需要更少的代码语法
- 非常适合“pandas”数据结构,这正是您作为数据科学家所需要的。
- 它建立在另一个庞大而深入的数据可视化库 Matplotlib 之上。
Syntax: seaborn.catplot(*, x=None, y=None, hue=None, data=None, row=None, col=None, kind=’strip’, color=None, palette=None, **kwargs)
Parameters
- x, y, hue: names of variables in data
Inputs for plotting long-form data. See examples for interpretation. - data: DataFrame
Long-form (tidy) dataset for plotting. Each column should correspond to a variable, and each row should correspond to an observation. - row, col: names of variables in data, optional
Categorical variables that will determine the faceting of the grid. - kind: str, optional
The kind of plot to draw, corresponds to the name of a categorical axes-level plotting function. Options are: “strip”, “swarm”, “box”, “violin”, “boxen”, “point”, “bar”, or “count”. - color: matplotlib color, optional
Color for all of the elements, or seed for a gradient palette. - palette: palette name, list, or dict
Colors to use for the different levels of the hue variable. Should be something that can be interpreted by color_palette(), or a dictionary mapping hue levels to matplotlib colors. - kwargs: key, value pairings
Other keyword arguments are passed through to the underlying plotting function.
例子:
如果您正在处理涉及任何分类变量(如调查响应)的数据,那么可视化和比较数据不同特征的最佳工具是分类图。绘制分类图在 seaborn 中非常容易。在此示例中,x、y 和色调采用数据中要素的名称。色调参数对目标变量的不同颜色的点进行编码。
Python3
import seaborn as sns

exercise = sns.load_dataset("exercise")
g = sns.catplot(x="time", y="pulse",
                hue="kind",
                data=exercise)
Python3
import seaborn as sns

sns.set_theme(style="ticks")
exercise = sns.load_dataset("exercise")

g = sns.catplot(x="time",
                kind="count",
                data=exercise)
Python3
import seaborn as sns

exercise = sns.load_dataset("exercise")
g = sns.catplot(x="time",
                y="pulse",
                kind="bar",
                data=exercise)
Python3
import seaborn as sns

exercise = sns.load_dataset("exercise")
g = sns.catplot(x="pulse",
                y="time",
                kind="bar",
                data=exercise)
Python3
import seaborn as sns


exercise = sns.load_dataset("exercise")

g = sns.catplot(x="time",
                y="pulse",
                hue="kind",
                data=exercise,
                kind="violin")
Python3
import seaborn as sns

exercise = sns.load_dataset("exercise")

g = sns.catplot(x="time",
                y="pulse",
                hue="kind",
                col="diet",
                data=exercise)
Python3
titanic = sns.load_dataset("titanic")
g = sns.catplot(x="alive", col="deck", col_wrap=4,
                data=titanic[titanic.deck.notnull()],
                kind="count", height=2.5, aspect=.8)
Python3
g = sns.catplot(x="age", y="embark_town",
                hue="sex", row="class",
                data=titanic[titanic.embark_town.notnull()],
                orient="h", height=2, aspect=3, palette="Set3",
                kind="violin", dodge=True, cut=0, bw=.2)
Python3
tips = sns.load_dataset('tips')
sns.catplot(x='day',
            y='total_bill',
            data=tips,
            kind='box');
输出:
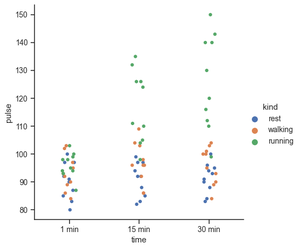
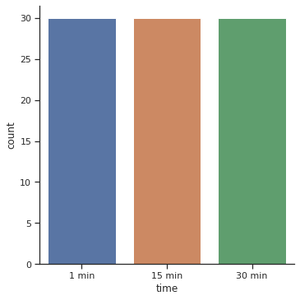
对于计数图,我们设置了一个 kind 参数来使用数据参数对数据进行计数和输入。让我们从探索时间功能开始。我们从 catplot()函数开始,并使用 x 参数来指定我们想要显示类别的轴。
蟒蛇3
import seaborn as sns

sns.set_theme(style="ticks")
exercise = sns.load_dataset("exercise")

g = sns.catplot(x="time",
                kind="count",
                data=exercise)
输出:
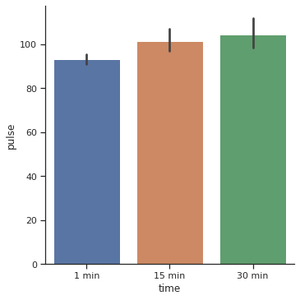
绘制分类数据的另一个流行选择是条形图。在计数图示例中,我们的图只需要一个变量。在条形图中,我们经常使用一个分类变量和一个定量变量。让我们看看时间如何相互比较。
蟒蛇3
import seaborn as sns

exercise = sns.load_dataset("exercise")
g = sns.catplot(x="time",
                y="pulse",
                kind="bar",
                data=exercise)
输出:
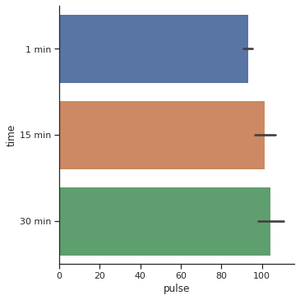
为了创建水平条形图,我们必须更改 x 和 y 特征。当您有很多类别或很长的类别名称时,最好更改方向。
蟒蛇3
import seaborn as sns

exercise = sns.load_dataset("exercise")
g = sns.catplot(x="pulse",
                y="time",
                kind="bar",
                data=exercise)
输出:
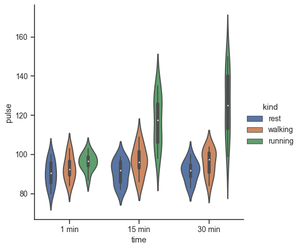
使用不同的绘图类型来可视化相同的数据:
蟒蛇3
import seaborn as sns


exercise = sns.load_dataset("exercise")

g = sns.catplot(x="time",
                y="pulse",
                hue="kind",
                data=exercise,
                kind="violin")
输出:
蟒蛇3
import seaborn as sns

exercise = sns.load_dataset("exercise")

g = sns.catplot(x="time",
                y="pulse",
                hue="kind",
                col="diet",
                data=exercise)
输出:

制作许多列面并将它们包装到网格的行中。方面将改变宽度,同时保持高度不变。
蟒蛇3
titanic = sns.load_dataset("titanic")
g = sns.catplot(x="alive", col="deck", col_wrap=4,
                data=titanic[titanic.deck.notnull()],
                kind="count", height=2.5, aspect=.8)
输出:

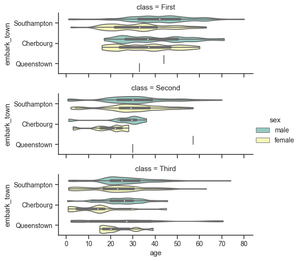
水平绘图并将其他关键字参数传递给绘图函数:
蟒蛇3
g = sns.catplot(x="age", y="embark_town",
                hue="sex", row="class",
                data=titanic[titanic.embark_town.notnull()],
                orient="h", height=2, aspect=3, palette="Set3",
                kind="violin", dodge=True, cut=0, bw=.2)
输出:
箱线图是一种视觉效果,可能有点难以理解,但非常精美地描绘了数据的分布。最好从一个箱线图的例子开始解释。我将使用 Seaborn 中常见的内置数据集之一:
蟒蛇3
tips = sns.load_dataset('tips')
sns.catplot(x='day',
            y='total_bill',
            data=tips,
            kind='box');
输出:
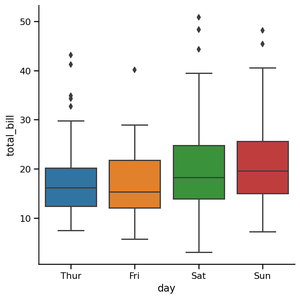
使用箱线图进行异常值检测:

蓝色框的边缘是所有票据分布的第 25 个和第 75 个百分位数。这意味着周四所有票据中有 75% 低于 20 美元,而另外 75%(从底部到顶部)高于近 13 美元。框中的水平线显示分布的中值。
- 通过从第 75 个百分位数中减去第 25 个百分位数,求出四分位间距 (IQR):75% — 25%
- 异常值下限的计算方法是从 25 日减去 IQR 的 1.5 倍:25% — 1.5*IQR
- 异常值上限的计算方法是将 1.5 倍的 IQR 添加到第 75 次:75% + 1.5*IQR