如何在 R 中绘制置信区间?
在本文中,我们将讨论如何在 R 编程语言中绘制置信区间。
方法 1:使用 geom_point 和 geom_errorbar 绘制置信区间
在这种绘制置信区间的方法中,用户需要在工作的 r 控制台中安装和导入 ggplot2 包,这里 ggplot2 包负责绘制 ggplot2 图并将包功能的使用提供给用户。然后用户需要使用所需参数调用 geom_point()函数,这将简单地绘制给定数据的 ggplot 图,然后用户必须调用带有所需参数的 geom_errorbar()函数以获取置信区间将是 R 编程语言中传递的数据的误差线。
要在 R 控制台中安装和导入 ggplot2 包,用户必须遵循以下语法:
install.packages("ggplot2")
library("ggplot2")- geom_point()函数:此函数使用到点 geom 用于创建散点图。
Syntax: geom_point(mapping = NULL, data = NULL, stat = “identity”, position = “identity”, …)
Parameters:
- mapping: Set of aesthetic mappings created by aes() or aes_().
- data: The data to be displayed in this layer.
- stat: The statistical transformation to use on the data for this layer, as a string.
- position: Position adjustment, either as a string, or the result of a call to a position adjustment function.
- …: Other arguments passed.
- geom_errorbar()函数:此函数用于绘制给定数据的误差线。
Syntax: geom_errorbar(mapping = NULL, data = NULL,stat = “identity”, position = “identity”, …)
Parameters:
- mapping: The aesthetic mapping, usually constructed with aes or aes_string.
- data: A layer-specific dataset – only needed if you want to override the plot defaults.
- stat: The statistical transformation to use on the data for this layer.
- position: The position adjustment to use for overlapping points on this layer
- …: other arguments passed on to layer.
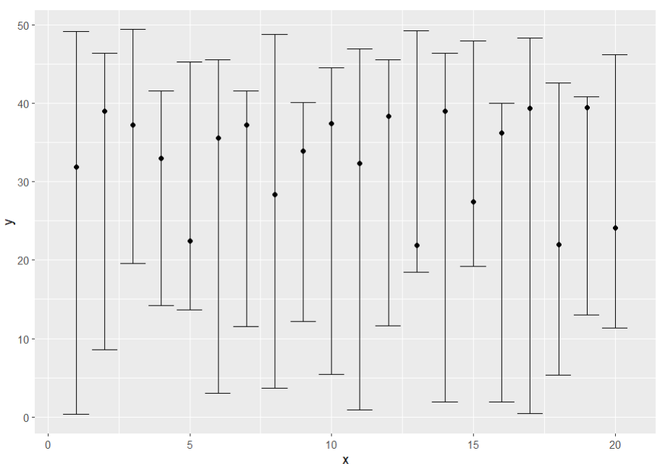
示例:在这里,我们将使用 geom_point()函数在 ggplot 上绘制点,然后将使用 geom_errorbar()函数来获取 R 编程语言中绘图的置信区间。
R
# Import ggplot2 library
library("ggplot2")

# Creating Data
gfg<-round(data.frame(x = 1:20,
                      y = runif(20, 20, 40),
                      low = runif(20, 0, 20),
                      up = runif(20, 40, 50)), 4)

# Creating scatter plot with its
# confindence intervals
ggplot(gfg, aes(x, y)) + geom_point() +
geom_errorbar(aes(ymin = low, ymax = up))
R
# Import plotrix library
library("plotrix")

# Create Data
gfg<-round(data.frame(x = 1:20,
                      y = runif(20, 20, 40),
                      low = runif(20, 0, 20),
                      up = runif(20, 40, 50)), 4)

# Create plotrix plot with confidence intervals
plotCI(x = gfg$x,y = gfg$y,li = gfg$low,ui = gfg$up)
输出:
方法 2:使用 plotCI()函数绘制置信区间
在这种绘制置信区间的方法中,用户需要安装并导入 plotrix 包以在工作的 R 控制台中使用其功能,然后用户需要以数据作为函数的参数调用 plotCI()函数此外,它的函数将直接绘制带有 R 编程语言中包含的置信区间的图。
要在 R 控制台中安装和导入 ggplot2 包,用户必须遵循以下语法:
install.packages("plotrix")
library("plotrix")- plotCI函数:给定一组 x 和 y 值以及区间宽度或上下限,绘制带有误差线的点。
Syntax: plotCI(x, y = NULL,ui, li, err=’y’, … )
Parameters:
- x,y: Coordinates for the center of error bars. y defaults to 1:n.
- UI: upper end of error bars.
- li: lower end of error bars.
- …: other plotting parameters.
示例:在此示例中,我们将使用 plotCI()函数在 R 编程语言中绘制给定数据图中的置信区间。
R
# Import plotrix library
library("plotrix")

# Create Data
gfg<-round(data.frame(x = 1:20,
                      y = runif(20, 20, 40),
                      low = runif(20, 0, 20),
                      up = runif(20, 40, 50)), 4)

# Create plotrix plot with confidence intervals
plotCI(x = gfg$x,y = gfg$y,li = gfg$low,ui = gfg$up)
输出:

