使用 R 中的 ggplot2 手动着色置信区间
在本文中,我们将看到如何在 R 编程语言中使用 ggplot2 手动生成着色置信区间。
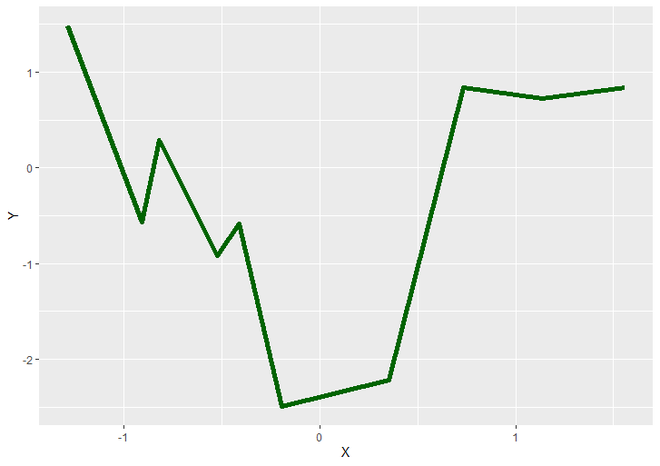
让我们首先绘制一条规则曲线,然后为其添加置信区间。
例子:
R
# Load Packages
library("ggplot2")

# Create a DataFrame for Plotting
DF <- data.frame(X = rnorm(10),
                 Y = rnorm(10))

# Plot the ggplot2 plot
ggplot(DF, aes(X, Y)) +
  geom_line(color = "dark green", size = 2)
R
# Load Packages
library("ggplot2")

# Create DataFrame for Plotting
DF <- data.frame(X = rnorm(10),
                 Y = rnorm(10))

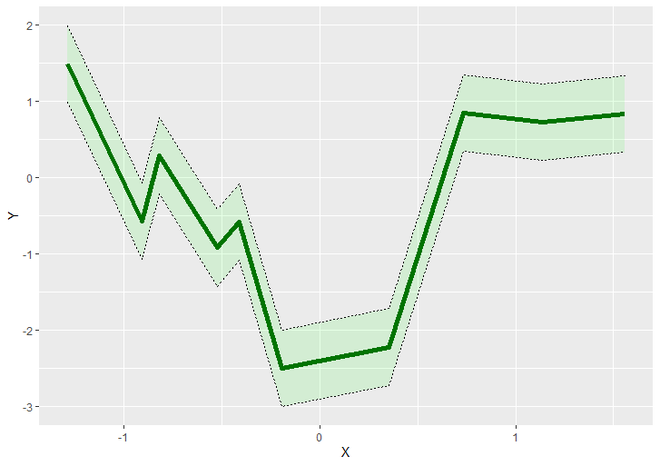
# ggplot2 LineGraph with Shading Confidence Interval
ggplot(DF, aes(X, Y)) +
  geom_line(color = "dark green", size = 2) +
  geom_ribbon(aes(ymin=Y+0.5, ymax=Y-0.5), alpha=0.1, fill = "green",
              color = "black", linetype = "dotted")
输出:

使用 ggplot2 的 LineGraph
要添加阴影置信区间,使用geom_ribbon()函数。它显示由 ymin 和 ymax 定义的 Y 间隔。它具有 ymin 和 ymax 的美学映射。除此之外,它还有一些不必要的参数。
Syntax : geom_ribbon(mapping, color, fill, linetype, alpha, …)
Parameters :
- mapping : aesthetic created by aes() to define ymin and ymax.
- color : Specifies the color of border of the Shading interval.
- fill : Specifies the color of Shading Confidence Interval.
- linetype : Specifies the linetype of the border of Confidence Interval.
- alpha : Specifies the Opacity of the Shading Interval.
- … : geom_ribbon also has other parameters such as data, stat, position, show.legend, etc. You can use them as per your requirements but in general case they are not useful as much.
Return : Y interval with the specified range.
例子:
电阻
# Load Packages
library("ggplot2")

# Create DataFrame for Plotting
DF <- data.frame(X = rnorm(10),
                 Y = rnorm(10))

# ggplot2 LineGraph with Shading Confidence Interval
ggplot(DF, aes(X, Y)) +
  geom_line(color = "dark green", size = 2) +
  geom_ribbon(aes(ymin=Y+0.5, ymax=Y-0.5), alpha=0.1, fill = "green",
              color = "black", linetype = "dotted")
输出:

带阴影置信区间的线图