R 编程中的 Esquisse 包
R 编程中的包是 R 函数、编译代码和示例数据的集合。它们存储在 R 环境中名为“ library ”的目录下。默认情况下,R 在安装过程中安装一组包。 R 中最重要的包之一是Esquisse包。 Esquisse包有助于以交互方式探索和可视化您的数据。这是一个闪亮的小工具,可以通过拖放以交互方式创建 ggplot 图表来映射您的变量。人们可以根据其类型快速可视化数据,导出为“PNG”或“PowerPoint”,并检索代码以重现图表。
安装
要在 R 编程中使用包,必须先安装包。可以使用命令install.packages(“packagename”)完成此任务。
source("https://install-github.me/dreamRs/esquisse")
install.packages("esquisse")
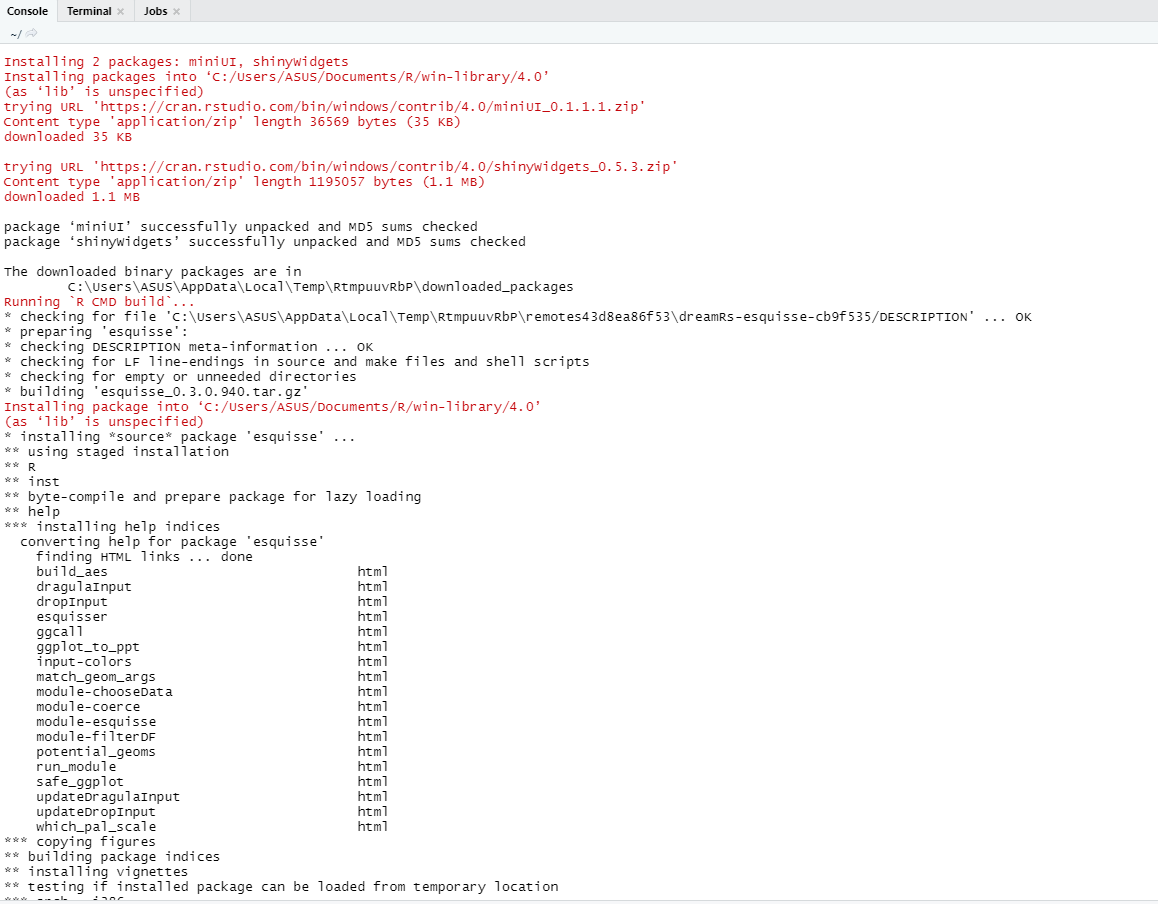
要从 GitHub 安装开发版本,请键入:
# or with devtools:
devtools::install_github("dreamRs/esquisse")
Esquisse 包中的重要动词函数
- chooseData-Module:是一个从用户环境中选择data.frame并选择要使用的变量的模块。它为用户提供了一个选项,可以从给定的可用数据集列表中进行选择,以便在闪亮的应用程序中进行处理。
Syntax:
chooseDataUI(id)
chooseDataServer(input, output, session, data = NULL, name = NULL,
selectVars = TRUE, launchOnStart = TRUE, defaultData = NULL)
Parameter | Description |
|---|---|
| id | Module’s id. |
| input | Standard shiny input. |
| output | Standard shiny output. |
| session | Standard shiny session. |
| data | data.frame to use by default. |
| name | The name of data. |
| selectVars | Logical (TRUE/FALSE), display menu to select vars to use in selected data.frame. |
| launchOnStart | Launch modal when application is launched. |
| defaultData | A character vector of data.frames to choose along if there is no data.frames in Global environment. By default, data.frames from ggplot2 are used. |
例子:
R
# Import shiny and
# esquisse packages
library(shiny)
library(esquisse)

ui <- fluidPage(
  tags$h2("Choose data module"),
  fluidRow(
    column(
      width = 4, tags$h4("Default"),
      # Using chooseDataUI
      chooseDataUI(id = "choose1"),
      verbatimTextOutput(outputId = "res1"))))

server <- function(input, output, session)
{
  res_dat1 <- callModule(
    chooseDataServer, id = "choose1",
    launchOnStart = FALSE)
  output$res1 <- renderPrint({
    str(reactiveValuesToList(res_dat1))})
}

shinyApp(ui,server)
R
# Import shiny and
# esquisse packages
library("shiny")
library("esquisse")

ui <- fluidPage(
  tags$h2("dragulaInput demo for geeksforgeeks"),
  tags$br(),
  # using dragulaInput()
  # to create a drag and
  # drop widget
  dragulaInput(
    inputId = "data_di", sourceLabel = "Source",
    targetsLabels = c("Drop Here", "Drop Here 2"),
    choices = names(rock), width = "400px"),
    verbatimTextOutput(outputId = "result"))

server <- function(input, output, session)
{
  output$result <- renderPrint(str(input$data_di))
}

shinyApp(ui = ui, server = server)
R
# Import shiny and
# esquisse packages
library("shiny")
library("esquisse")

esquisser(rock)
R
# Import shiny and
# esquisse packages
library("shiny")
library("esquisse")

ui <- fluidPage(
  tags$h2("GfG demo for Update dragulaInput"),
  radioButtons(
    inputId = "update", label = "Dataset",
    choices = c("iris", "rock")),
  tags$br(),
  dragulaInput(
    inputId = "data", sourceLabel = "Variables",
    targetsLabels = c("X", "Y", "fill", "color", "size"),
    choices = names(iris), replace = TRUE,
    width = "400px", status = "success"),
    verbatimTextOutput(outputId = "result"))

server <- function(input, output, session)
{
  output$result <- renderPrint(str(input$data))
  observeEvent(input$update, {
    if (input$update == "iris")
    {
      updateDragulaInput(
        session = session, inputId = "data",
        choices = names(iris), status = "success")
    }
    else
    {
      updateDragulaInput(
        session = session, inputId = "data",
        choices = names(rock))
    }
  }, ignoreInit = TRUE)

}

shinyApp(ui, server)
R
# import ggplot2 library
library(ggplot2)
p <- ggplot(iris) +
     geom_point(aes(Sepal.Length, Sepal.Width))

# use ggplot_to_plot
# to display plot
# in a ppt format
ggplot_to_ppt("p")
输出:


- dragulaInput:它创建一个拖放输入小部件。可以从开发人员提供给应用程序用户的各种标签中选择不同的标签(数据),以通过简单的拖放布局进行调整。
Syntax: dragulaInput(inputId, sourceLabel, targetsLabels, targetsIds = NULL,
choices = NULL, choiceNames = NULL, choiceValues = NULL,
status = “primary”, replace = FALSE, badge = TRUE, width = NULL,
height = “200px”)
Parameter | Description |
|---|---|
| inputId | The input slot that will be used to access the value. |
| sourceLabel | Label display in the source box. |
| targetsLabels | Labels for each target element. |
| targetsIds | Ids for retrieving values server-side. |
| choices | List of values to select from. If this argument is provided, then choiceNames and choiceValues must not be provided, and vice-versa. |
| choiceNames | List of names and values, respectively, that are displayed to the user in the app and correspond to the each choice (for this reason, choiceNames and choiceValues must have the same length). |
| choiceValues | List of names and values, respectively, that are displayed to the user in the app and correspond to the each choice (for this reason, choiceNames and choiceValues must have the same length). |
| status | If choices are displayed into a Bootstrap label, you can use Bootstrap status to color them, or NULL. |
| replace | When a choice is draged in a target container already containing a choice, does the later be replaced by the new one ?#’ |
| badge | Displays choices inside a Bootstrap badge. |
| width | Width of the input. |
| height | Height of each boxes, the total input height is this parameter X 2. |
例子:
电阻
# Import shiny and
# esquisse packages
library("shiny")
library("esquisse")

ui <- fluidPage(
  tags$h2("dragulaInput demo for geeksforgeeks"),
  tags$br(),
  # using dragulaInput()
  # to create a drag and
  # drop widget
  dragulaInput(
    inputId = "data_di", sourceLabel = "Source",
    targetsLabels = c("Drop Here", "Drop Here 2"),
    choices = names(rock), width = "400px"),
    verbatimTextOutput(outputId = "result"))

server <- function(input, output, session)
{
  output$result <- renderPrint(str(input$data_di))
}

shinyApp(ui = ui, server = server)
输出:


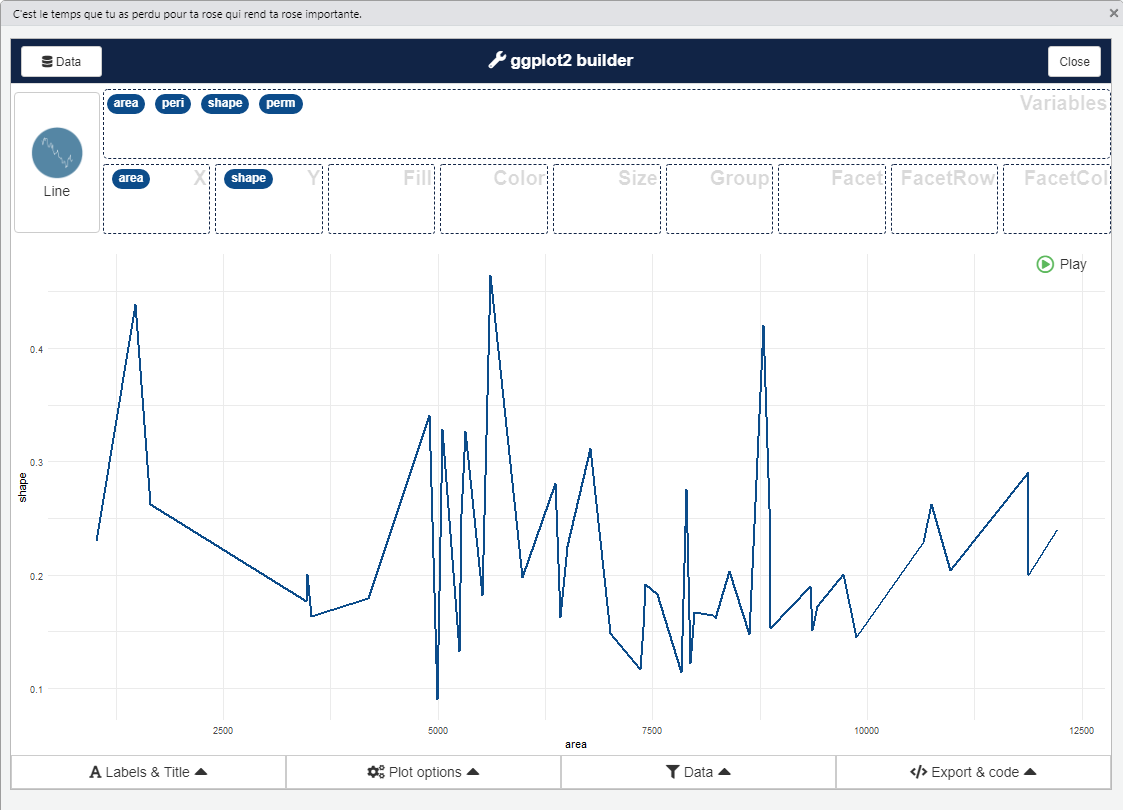
- esquisser:它是一个使用 ggplot2 轻松创建绘图的插件。 ggplot2 是一个以声明方式创建图形的系统。只需提供数据,告诉 ggplot2 如何将变量映射到美学,使用哪些图形原语,它就可以自行处理。
Syntax: esquisser(data = NULL)
Parameter | Description |
|---|---|
| data | A data.frame. |
例子:
电阻
# Import shiny and
# esquisse packages
library("shiny")
library("esquisse")

esquisser(rock)
输出:
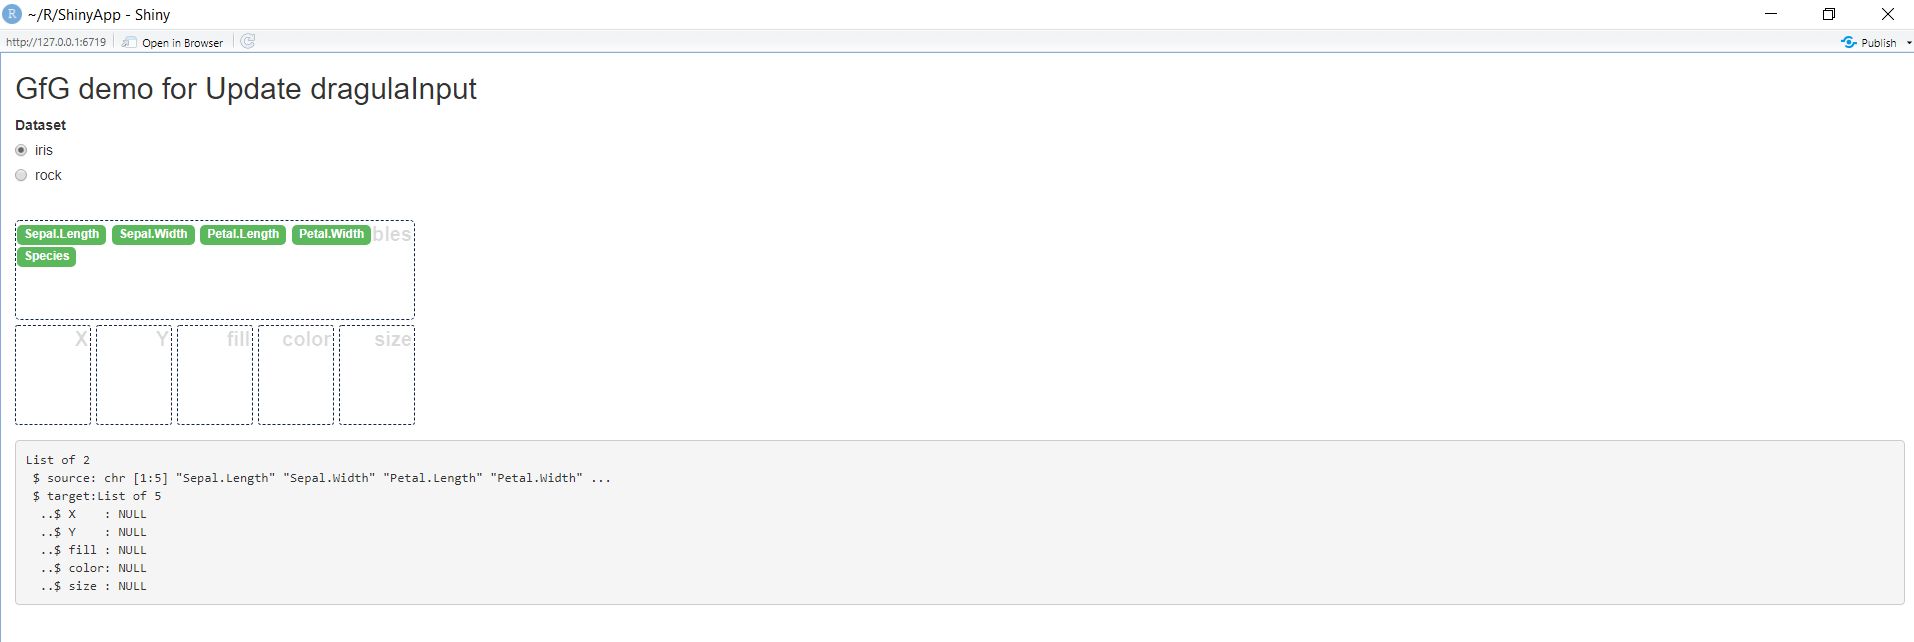
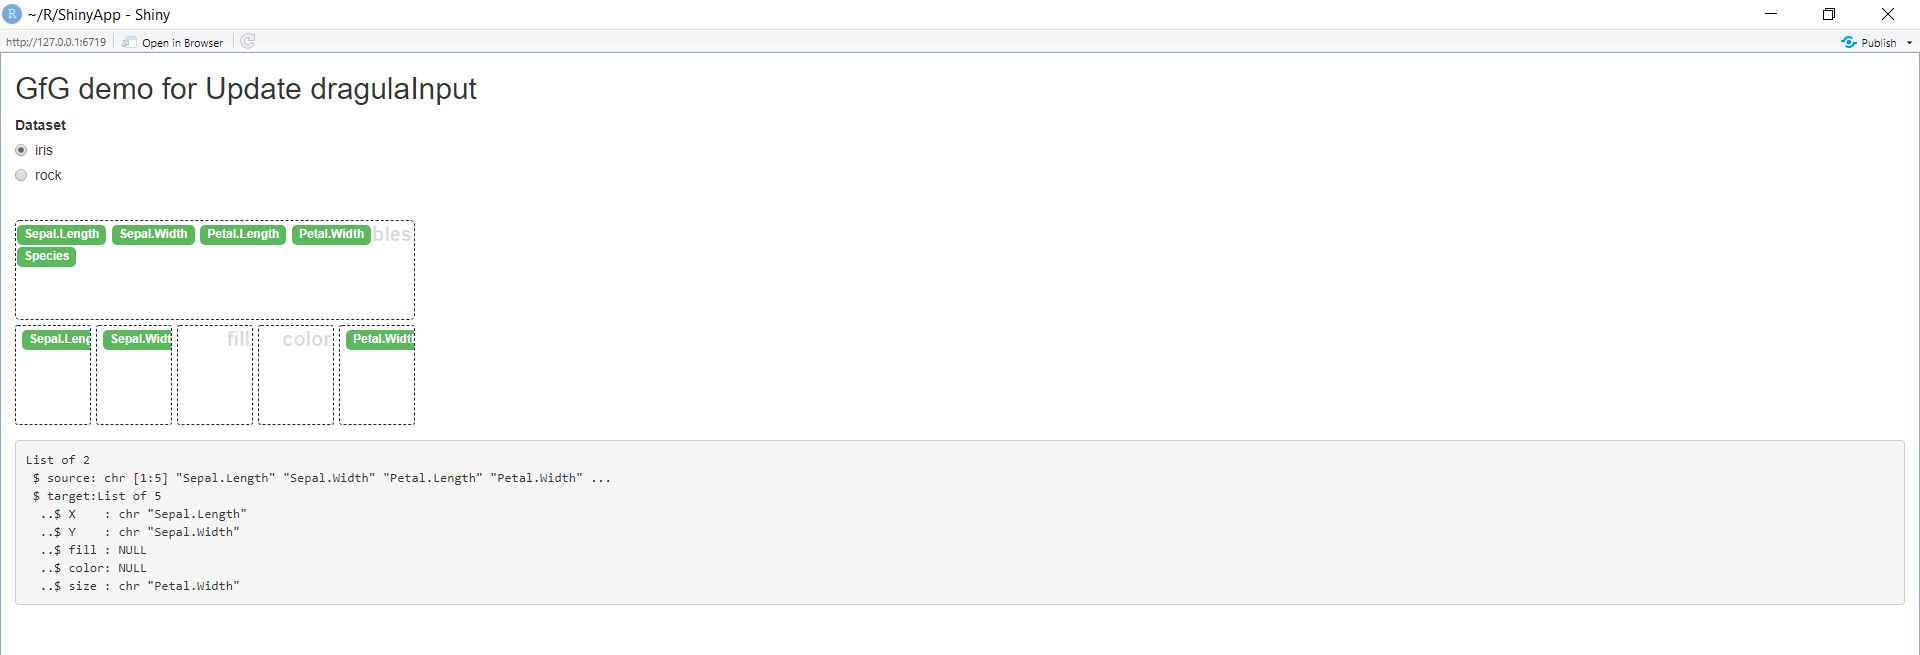
- updateDragulaInput:更新 Dragula 输入。一旦调用传递给函数,它就会更新拖放小部件。例如,如果从输入中拖放标签,则该函数会更新输出中提供的输入值集。
Syntax: updateDragulaInput(session, inputId, choices = NULL, choiceNames = NULL,
choiceValues = NULL, badge = TRUE, status = “primary”)
Parameter | Description |
|---|---|
| session | The session object passed to function given to shinyServer. |
| inputId | The id of the input object. |
| choice | List of values to select from. If this argument is provided, then choiceNames and choiceValues must not be provided, and vice-versa |
choiceNames choiceValues | List of names and values, respectively, that are displayed to the user in the app and correspond to the each choice (for this reason, choiceNames and choiceValues must have the same length). If either of these arguments is provided, then the other must be provided and choices must not be provided. |
| badge | Displays choices inside a Bootstrap badge. |
| status | If choices are displayed into a Bootstrap badge, you can use Bootstrap status to color them, or NULL. |
例子:
电阻
# Import shiny and
# esquisse packages
library("shiny")
library("esquisse")

ui <- fluidPage(
  tags$h2("GfG demo for Update dragulaInput"),
  radioButtons(
    inputId = "update", label = "Dataset",
    choices = c("iris", "rock")),
  tags$br(),
  dragulaInput(
    inputId = "data", sourceLabel = "Variables",
    targetsLabels = c("X", "Y", "fill", "color", "size"),
    choices = names(iris), replace = TRUE,
    width = "400px", status = "success"),
    verbatimTextOutput(outputId = "result"))

server <- function(input, output, session)
{
  output$result <- renderPrint(str(input$data))
  observeEvent(input$update, {
    if (input$update == "iris")
    {
      updateDragulaInput(
        session = session, inputId = "data",
        choices = names(iris), status = "success")
    }
    else
    {
      updateDragulaInput(
        session = session, inputId = "data",
        choices = names(rock))
    }
  }, ignoreInit = TRUE)

}

shinyApp(ui, server)
输出:
- ggplot_to_plot:将 ggplot 对象导出到 PowerPoint 的实用程序。此实用程序函数提供了一种将使用 ggplot 放置的图形和模型保存到 .ppt 文件或简单的 PowerPoint 演示文稿的简单方法。
Syntax: ggplot_to_ppt(gg = NULL)
Parameter | Description |
|---|---|
| gg | character. Name(s) of ggplot object(s), if NULL, launch the Shiny gadget. |
例子:
电阻
# import ggplot2 library
library(ggplot2)
p <- ggplot(iris) +
     geom_point(aes(Sepal.Length, Sepal.Width))

# use ggplot_to_plot
# to display plot
# in a ppt format
ggplot_to_ppt("p")
输出:
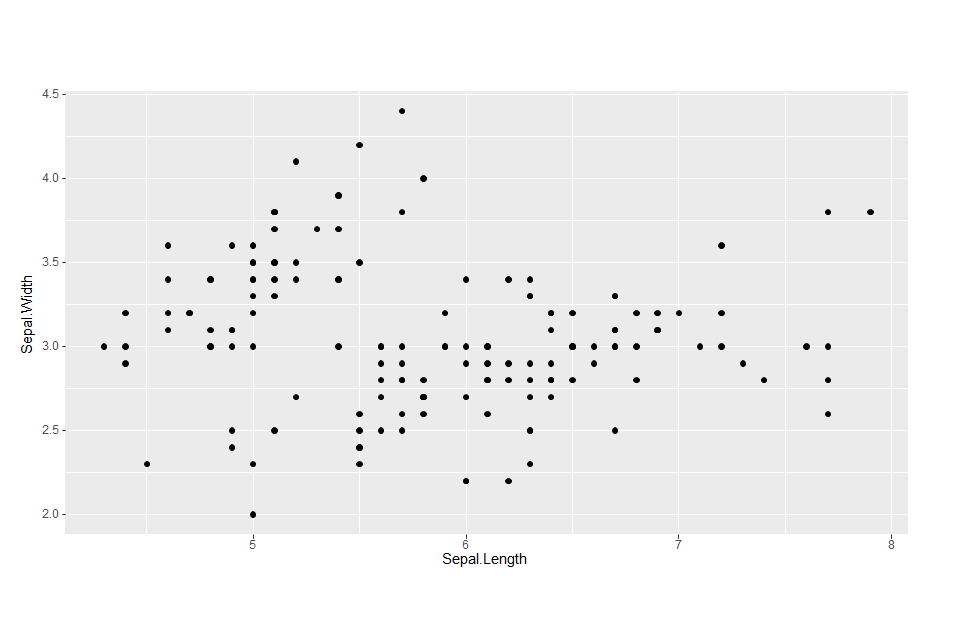
该代码以 ppt 格式显示输出。可以通过此链接查看上述代码的输出。