使用Python和 OpenCV 对图像进行负变换
图像也称为一组像素。当我们将图像存储在计算机中或以数字方式存储时,会存储相应的像素值。因此,当我们在Python中使用 OpenCV 将图像读取到变量时,该变量会存储图像的像素值。当我们尝试对图像进行负转换时,最亮的区域会被转换为最暗的区域,而最暗的区域会被转换为最亮的区域。
众所周知,彩色图像存储 3 个不同的通道。它们是红色、绿色和蓝色。这就是为什么彩色图像也被称为 RGB 图像的原因。因此,如果我们需要对图像进行负变换,则需要反转这 3 个通道。
让我们通过在直方图中绘制彩色图像来查看它的 3 个通道。
输入图像 -

# We need cv2 module for image
# reading and matplotlib module
# for plotting
import cv2
import matplotlib.pyplot as plt

img_bgr = cv2.imread('scenary.jpg', 1)

color = ('b', 'g', 'r')

for i, col in enumerate(color):
    histr = cv2.calcHist([img_bgr], [i], None, [256], [0, 256])
    plt.plot(histr, color = col)
    plt.xlim([0, 256])

plt.show()
输出:
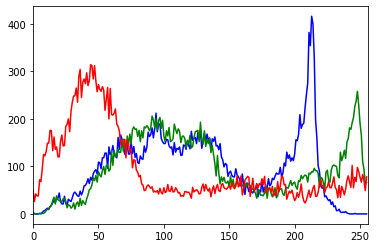
在这里,3 个通道(红色、绿色、蓝色)重叠并创建一个直方图。如果您之前研究过像素和 RGB,您可能知道每种颜色包含 256 个值。如果颜色的 RGB 值为 (255, 255, 255),则该颜色显示为白色,如果颜色的 RGB 值为 (0, 0, 0),则该颜色显示为黑色。像这样,上面的 3 个通道也包含 256 个像素。
因此,X 轴显示总共 256 个值 (0 – 255),Y 轴显示每个通道的总频率。正如您在直方图中看到的那样,蓝色通道的频率最高,您可以通过查看它轻松标记图像中存在的蓝色量。
图像的负变换
让我们创建图像的负变换。使用 OpenCV 模块有两种不同的方法可以将图像转换为负片。第一种方法逐步解释负变换,第二种方法解释单行图像的负变换。
第一种方法:负转换的步骤
- 读取图像
- 获取图像的高度和宽度
- 每个像素包含 3 个通道。因此,取一个像素值并收集 3 个不同变量中的 3 个通道。
- 从 255 中取反 3 个像素值并将它们再次存储在之前使用的像素中。
- 对图像中存在的所有像素值执行此操作。
第一种方法的Python代码:-
import cv2
import matplotlib.pyplot as plt


# Read an image
img_bgr = cv2.imread('scenary.jpg', 1)
plt.imshow(img_bgr)
plt.show()

# Histogram plotting of the image
color = ('b', 'g', 'r')

for i, col in enumerate(color):

    histr = cv2.calcHist([img_bgr],
                         [i], None,
                         [256],
                         [0, 256])

    plt.plot(histr, color = col)

    # Limit X - axis to 256
    plt.xlim([0, 256])

plt.show()

# get height and width of the image
height, width, _ = img_bgr.shape

for i in range(0, height - 1):
    for j in range(0, width - 1):

        # Get the pixel value
        pixel = img_bgr[i, j]

        # Negate each channel by
        # subtracting it from 255

        # 1st index contains red pixel
        pixel[0] = 255 - pixel[0]

        # 2nd index contains green pixel
        pixel[1] = 255 - pixel[1]

        # 3rd index contains blue pixel
        pixel[2] = 255 - pixel[2]

        # Store new values in the pixel
        img_bgr[i, j] = pixel

# Display the negative transformed image
plt.imshow(img_bgr)
plt.show()

# Histogram plotting of the
# negative transformed image
color = ('b', 'g', 'r')

for i, col in enumerate(color):

    histr = cv2.calcHist([img_bgr],
                         [i], None,
                         [256],
                         [0, 256])

    plt.plot(histr, color = col)
    plt.xlim([0, 256])

plt.show()
输出 :
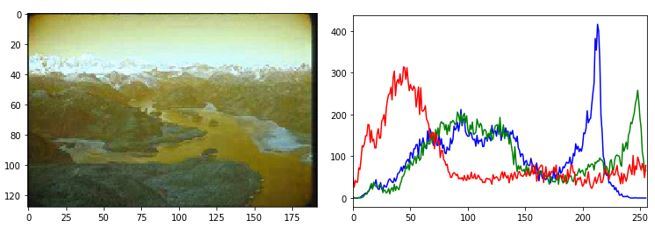
(原始图像和直方图)

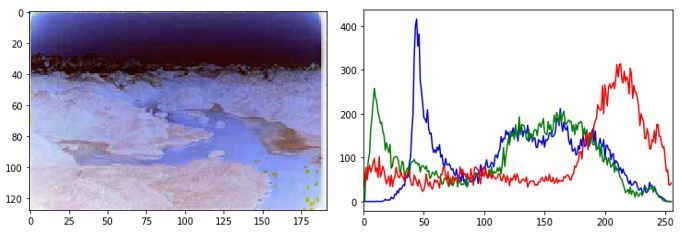
(负像和直方图)
方法二:负变换步骤
- 读取图像并将其存储在变量中。
- 从 1 中减去变量并将值存储在另一个变量中。
- 全部做完。你成功地完成了负转换。
第二种方法的Python代码:-
import cv2
import matplotlib.pyplot as plt


# Read an image
img_bgr = cv2.imread('scenary.jpg', 1)

plt.imshow(img_bgr)
plt.show()

# Histogram plotting of original image
color = ('b', 'g', 'r')

for i, col in enumerate(color):

    histr = cv2.calcHist([img_bgr],
                         [i], None,
                         [256],
                         [0, 256])

    plt.plot(histr, color = col)

    # Limit X - axis to 256
    plt.xlim([0, 256])

plt.show()

# Negate the original image
img_neg = 1 - img_bgr

plt.imshow(img_neg)
plt.show()

# Histogram plotting of
# negative transformed image
color = ('b', 'g', 'r')

for i, col in enumerate(color):

    histr = cv2.calcHist([img_neg],
                         [i], None,
                         [256],
                         [0, 256])

    plt.plot(histr, color = col)
    plt.xlim([0, 256])

plt.show()
输出 :

(原始图像和直方图)
(负像和直方图)