Python中的 plotly.figure_factory.create_annotated_heatmap()函数
Python的 Plotly 库对于数据可视化和简单轻松地理解数据非常有用。
plotly.figure_factory.create_annotated_heatmap
创建带注释的热图并向热图的每个单元格添加注释的函数。
Syntax:plotly.figure_factory.create_annotated_heatmap(z, x=None, y=None, annotation_text=None, colorscale=’Plasma’, font_colors=None, showscale=False, reversescale=False, **kwargs)
Parameter:
z ((list[list]|ndarray)) – it describe the z matrix to create heatmap.
x ((list)) – it describe the x axis labels.
y ((list)) – it describe the y axis labels.annotation_text ((list[list]|ndarray)) – Text strings for annotations. Should have the same dimensions as the z matrix. If no text is added, the values of the z matrix are annotated. Default = z matrix values.
colorscale ((list|str)) – it describe heatmap colorscale.
font_colors ((list)) – it describes the list of two color strings: [min_text_color, max_text_color]
showscale ((bool)) – it display colorscale with Default as False
reversescale ((bool)) – it reverse colorscale with Default as False
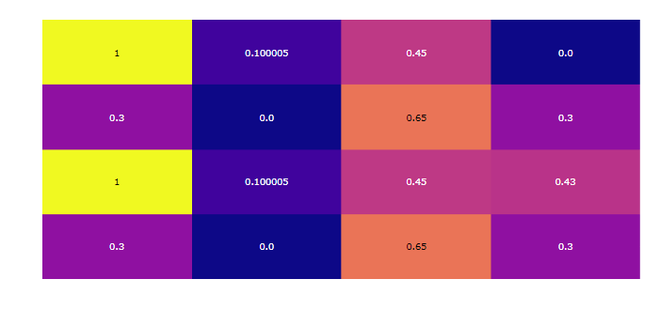
示例 1:具有默认配置的简单注释热图
Python3
import plotly.figure_factory as ff


z = [[0.300000, 0.00000, 0.65, 0.300000],
     [1, 0.100005, 0.45, 0.4300],
     [0.300000, 0.00000, 0.65, 0.300000],
     [1, 0.100005, 0.45, 0.00000]]
fig = ff.create_annotated_heatmap(z)
fig.show()
Python3
import plotly.figure_factory as ff

z = [[.1, .3, .5, .7],
     [1, .8, .6, .4],
     [.6, .4, .2, .0],
     [.9, .7, .5, .3]]

fig = ff.create_annotated_heatmap(z, colorscale='Viridis')
fig.show()
输出:
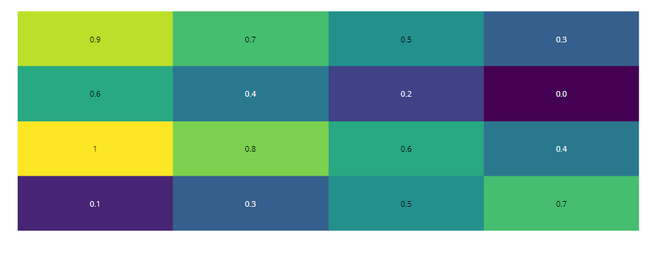
示例 2:定义的色阶
Python3
import plotly.figure_factory as ff

z = [[.1, .3, .5, .7],
     [1, .8, .6, .4],
     [.6, .4, .2, .0],
     [.9, .7, .5, .3]]

fig = ff.create_annotated_heatmap(z, colorscale='Viridis')
fig.show()
输出:

