以热图样式显示 Pandas DataFrame
Python编程语言中的Pandas库因其创建各种数据结构的能力而被广泛使用,并且它还提供了许多要对数字和时间序列数据执行的操作。通过以热图样式显示熊猫数据框,用户可以获得数字数据的可视化。它概述了完整的数据帧,这使得理解数据帧中的关键点变得非常容易。
热图是一种矩阵类型的二维图形,它以单元格的形式提供数字数据的可视化。热图的每个单元格都是彩色的,颜色的深浅表示值与数据框的某种关系。以下是一些以热图样式显示 Panda 数据框的方法。
以这个数据框为例:
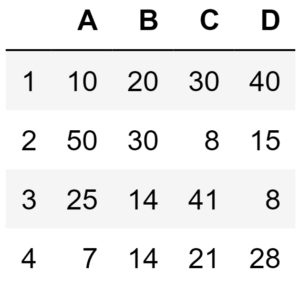
方法一:使用 Pandas 库
在这种方法中,Pandas 库将用于生成数据框和热图。热图的单元格将显示与数据框对应的值。下面是实现。
# Python program to generate a heatmap
# which displays the value in each cell
# corresponding to the given dataframe

# import required libraries
import pandas as pd

# defining index for the dataframe
idx = ['1', '2', '3', '4']

# defining columns for the dataframe
cols = list('ABCD')

# entering values in the index and columns
# and converting them into a panda dataframe
df = pd.DataFrame([[10, 20, 30, 40], [50, 30, 8, 15],
                   [25, 14, 41, 8], [7, 14, 21, 28]],
                   columns = cols, index = idx)

# displaying dataframe as an heatmap
# with diverging colourmap as virdis
df.style.background_gradient(cmap ='viridis')\
        .set_properties(**{'font-size': '20px'})
输出 : 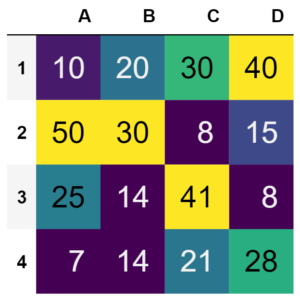
方法2:使用matplotlib库
在此方法中,Panda 数据框将显示为热图,其中热图的单元格将根据数据框中的值进行颜色编码。除了作为图形图例的热图之外,还会出现一个颜色条。下面是实现。
# Python program to generate a heatmap
# which represents panda dataframe
# in colour coding schemes

# import required libraries
import matplotlib.pyplot as plt
import pandas as pd

# Defining index for the dataframe
idx = ['1', '2', '3', '4']

# Defining columns for the dataframe
cols = list('ABCD')

# Entering values in the index and columns
# and converting them into a panda dataframe
df = pd.DataFrame([[10, 20, 30, 40], [50, 30, 8, 15],
                   [25, 14, 41, 8], [7, 14, 21, 28]],
                   columns = cols, index = idx)

# Displaying dataframe as an heatmap
# with diverging colourmap as RdYlBu
plt.imshow(df, cmap ="RdYlBu")

# Displaying a color bar to understand
# which color represents which range of data
plt.colorbar()

# Assigning labels of x-axis
# according to dataframe
plt.xticks(range(len(df)), df.columns)

# Assigning labels of y-axis
# according to dataframe
plt.yticks(range(len(df)), df.index)

# Displaying the figure
plt.show()
输出 : 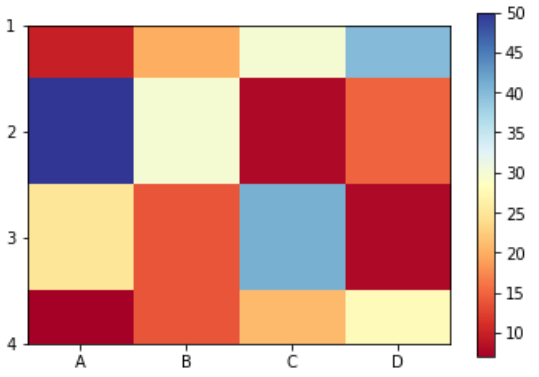
方法 3:使用 Seaborn 库
在这种方法中,将从 Panda 数据框生成热图,其中热图的单元格将包含与数据框对应的值,并将进行颜色编码。除了作为图形图例的热图之外,还将出现一个颜色条。下面是实现。
# Python program to generate heatmap which
# represents panda dataframe in color-coding schemes
# along with values mentioned in each cell

# import required libraries
import pandas as pd
import seaborn as sns % matplotlib inline

# Defining figure size
# for the output plot
fig, ax = plt.subplots(figsize = (12, 7))

# Defining index for the dataframe
idx = ['1', '2', '3', '4']

# Defining columns for the dataframe
cols = list('ABCD')

# Entering values in the index and columns
# and converting them into a panda dataframe
df = pd.DataFrame([[10, 20, 30, 40], [50, 30, 8, 15],
                   [25, 14, 41, 8], [7, 14, 21, 28]],
                   columns = cols, index = idx)

# Displaying dataframe as an heatmap
# with diverging colourmap as RdYlGn
sns.heatmap(df, cmap ='RdYlGn', linewidths = 0.30, annot = True)
输出 : 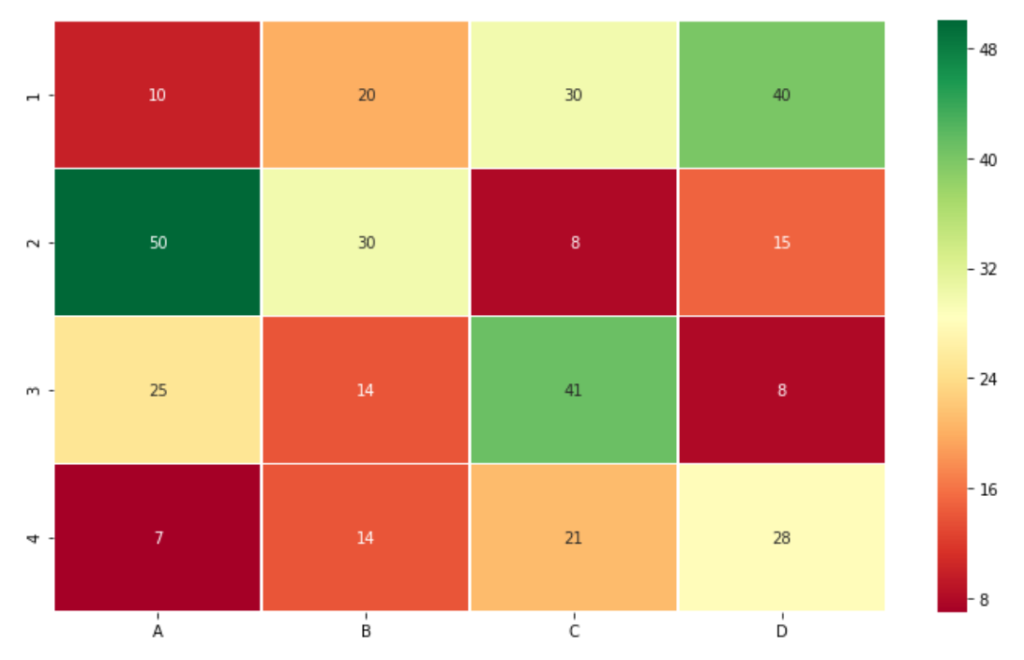
If the uppermost and the lowermost row of output figure does not appear with proper height then add below two lines after the last line of the above code.
方法四:使用 Panda 库生成相关矩阵
相关矩阵是一种特殊的热图,它显示了数据框的一些见解。此热图的单元格显示相关系数,这是数据帧变量之间的线性历史关系。在这种方法中,仅使用 Pandas 库来生成相关矩阵。下面是实现。
bottom, top = ax.get_ylim()
ax.set_ylim(bottom + 0.5, top - 0.5)
输出 : 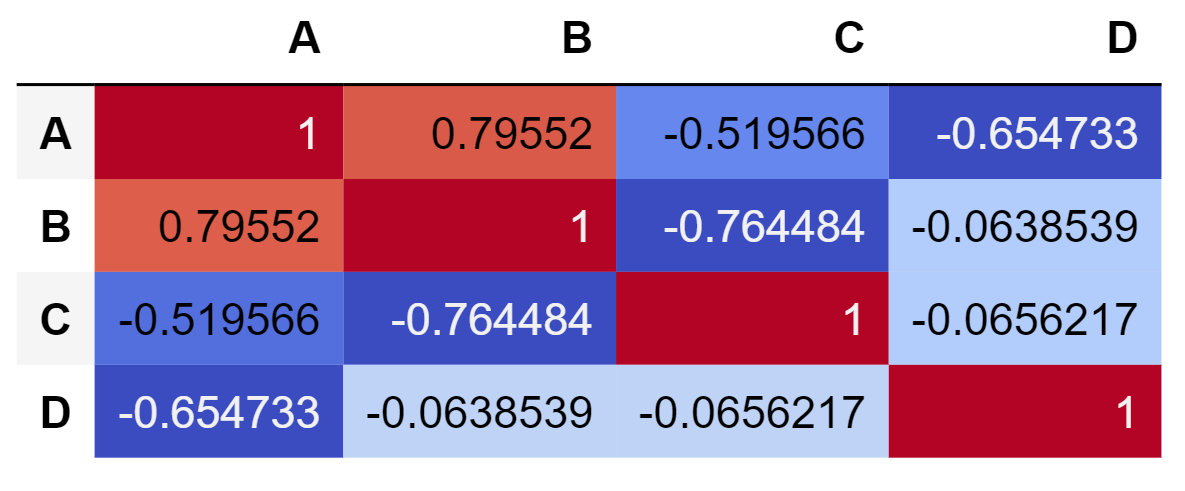
方法5:使用Seaborn库生成相关矩阵
相关矩阵也可以使用 Seaborn 库生成。生成的热图的单元格将包含相关系数,但与 Pandas 库生成的热图不同,这些值是四舍五入的。下面是实现。
# Python program to generate heatmap
# which represents correlation between
# columns of panda dataframe

# import required libraries
import pandas as pd

# Defining index for the dataframe
idx = ['1', '2', '3', '4']

# Defining columns for the dataframe
cols = list('ABCD')

# Entering values in the index and columns
# and converting them into a panda dataframe
df = pd.DataFrame([[10, 20, 30, 40], [50, 30, 8, 15],
                   [25, 14, 41, 8], [7, 14, 21, 28]],
                   columns = cols, index = idx)

# generating pairwise correlation
corr = df.corr()

# Displaying dataframe as an heatmap
# with diverging colourmap as coolwarm
corr.style.background_gradient(cmap ='coolwarm')
输出 : 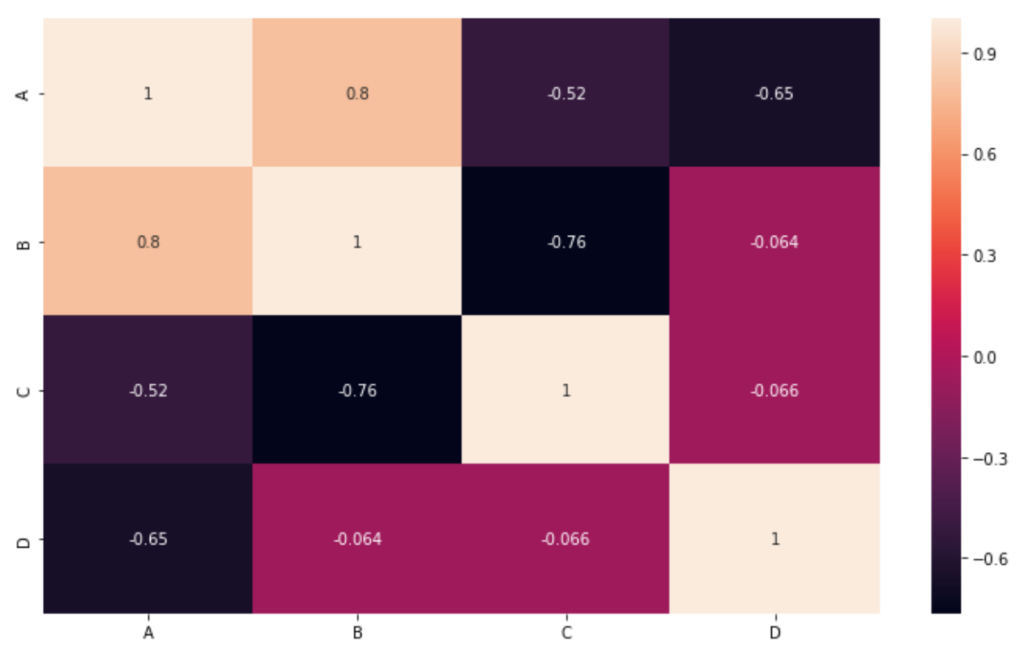
如果输出图形的最上一行和最下一行没有以适当的高度出现,则在上述代码的最后一行之后添加以下两行。
# Python program to generate a heatmap
# which represents the correlation between
# columns of panda dataframe

# import required libraries
import pandas as pd
import seaborn as sn

# Defining figure size
# for the output plot
fig, ax = plt.subplots(figsize = (12, 7))

# Defining index for the dataframe
idx = ['1', '2', '3', '4']

# Defining columns for the dataframe
cols = list('ABCD')

# Entering values in the index and columns
# and converting them into a panda dataframe
df = pd.DataFrame([[10, 20, 30, 40], [50, 30, 8, 15],
                   [25, 14, 41, 8], [7, 14, 21, 28]],
                   columns = cols, index = idx)

df = pd.DataFrame(df, columns =['A', 'B', 'C', 'D'])

corr = df.corr()
sn.heatmap(corr, annot = True)