在 R 中使用 ggplot2 更改注释的字体大小
ggplot2 是统计编程语言 R 的数据可视化包。在分析和绘制图形后,我们可以通过annotate()函数在我们的图形中添加注释。本文讨论如何使用 annotation()函数更改注释的字体大小。
Syntax: annotate()
Parameters:
- geom : specify text
- x : x axis location
- y : y axis location
- label : custom textual content
- color : color of textual content
- size : size of text
- fontface : fontface of text
- angle : angle of text
通过添加只有参数 geom='text' 的 annotate函数,它表明 ggplot 知道它必须添加文本,但它需要另一个参数,例如文本位置(x,y)和文本数据(标签=文本)。
方法
- 导入ggplot2
- 创建/导入数据集
- 在图表上绘制数据
- 添加带有所需参数的 annotation()函数
让我们首先创建一个没有注释的基本图。
程序 :
R
# Import Package
library(ggplot2)

# df dataset
df <- data.frame(a=c(2,4,8),
                 b=c(5, 10, 15))

# plot graph
plot = ggplot(df, aes(x = a, y = b)) + geom_point() + geom_line()

# output
plot
R
# Import Package
library(ggplot2)

# df dataset
df <- data.frame(a=c(2,4,8),
                 b=c(5, 10, 15))

# plot graph
plot = ggplot(df, aes(x = a, y = b)) + geom_point() + geom_line()

plot + annotate('text',
                x = 6, y = 7.5,
                label = 'GeeksForGeeks',
                color='darkgreen')
R
# Import Package
library(ggplot2)

# df dataset
df <- data.frame(a=c(2,4,8),
                 b=c(5, 10, 15))

# plot graph
plot = ggplot(df, aes(x = a, y = b)) + geom_point() + geom_line()

plot + annotate('text', x = 6, y = 7.5,
                  label = 'GeeksForGeeks',
                  color='red',
                  size = 10)
输出:
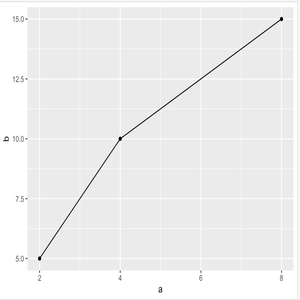
基本图
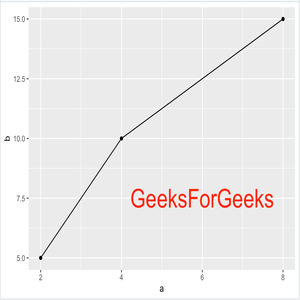
现在,让我们看看如何添加注解。
程序 :
电阻
# Import Package
library(ggplot2)

# df dataset
df <- data.frame(a=c(2,4,8),
                 b=c(5, 10, 15))

# plot graph
plot = ggplot(df, aes(x = a, y = b)) + geom_point() + geom_line()

plot + annotate('text',
                x = 6, y = 7.5,
                label = 'GeeksForGeeks',
                color='darkgreen')
输出:

标签和颜色
要更改文本的大小,请使用“size”参数。在下面的示例中,GeeksForGeeks 的大小为 10,颜色为红色。
程序 :
电阻
# Import Package
library(ggplot2)

# df dataset
df <- data.frame(a=c(2,4,8),
                 b=c(5, 10, 15))

# plot graph
plot = ggplot(df, aes(x = a, y = b)) + geom_point() + geom_line()

plot + annotate('text', x = 6, y = 7.5,
                  label = 'GeeksForGeeks',
                  color='red',
                  size = 10)
输出:
尺寸