更改 R 中 ggplot2 分面网格标签的字体大小
在本文中,我们将看到如何在 R 编程语言中更改 ggplot2 Facet Grid Labels 的字体大小。
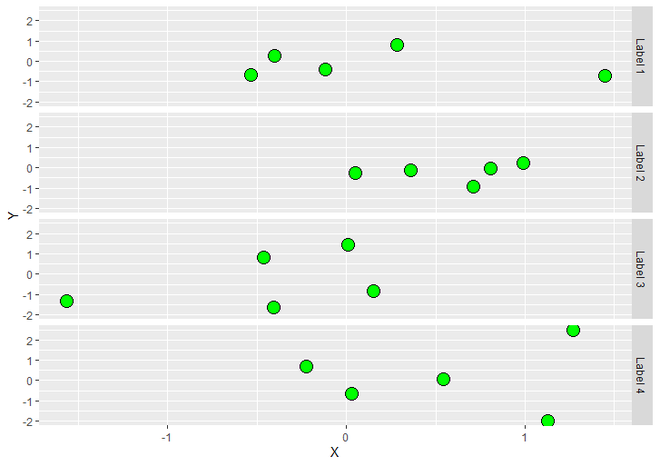
让我们首先绘制一个没有任何变化的规则图,以便差异明显。
例子:
R
library("ggplot2")

DF <- data.frame(X = rnorm(20),
                 Y = rnorm(20),
                 group = c("Label 1", "Label 2",
                           "Label 3", "Label 4"))

ggplot(DF, aes(X, Y)) +
  geom_point(size = 5, fill = "green",
             color = "black", shape = 21) +
  facet_grid(group ~ .)
R
library("ggplot2")

DF <- data.frame(X = rnorm(20),
                 Y = rnorm(20),
                 group = c("Label 1", "Label 2",
                           "Label 3", "Label 4"))

ggplot(DF, aes(X, Y)) +
  geom_point(size = 5, fill = "green",
             color = "black", shape = 21) +
  facet_grid(group ~ .)+
  theme(strip.text = element_text(
    size = 20, color = "dark green"))
R
library("ggplot2")

DF <- data.frame(X = rnorm(20),
                 Y = rnorm(20),
                 group = c("Label 1", "Label 2",
                           "Label 3", "Label 4"))

ggplot(DF, aes(X, Y)) +
  geom_point(size = 5, fill = "green",
             color = "black", shape = 21) +
  facet_grid(group ~ .)+
  theme(strip.text = element_text(
    size = 5, color = "dark green"))
输出 :

使用 ggplot2 的分面散点图
默认情况下,标签的大小由 Facets 给出,这里是 9。但我们可以更改大小。为此,我们使用 theme()函数,该函数用于自定义绘图的外观。我们可以改变刻面标签的大小,使用strip.text它应该传递的值来生成所需大小的标签。
Syntax : theme(strip.text)
Parameter :
- strip.text : For customize the Facet Labels. For horizontal facet labels ‘strip.text.x’ & for verticle facet labels ‘strip.text.y’ is used. this function only takes element_text() function as it’s value. We have to assign factors that we want to modify to element_text .
Return : Theme of the plot.
element_text 是文本的主题元素,用于修改文本的样式或主题。它有许多参数用于不同样式的文本。 size是其中之一,它会改变文本的大小。
Syntax : element_text(size, color)
Parameters :
- size : Size of Text.
Return : Change the style of Text.
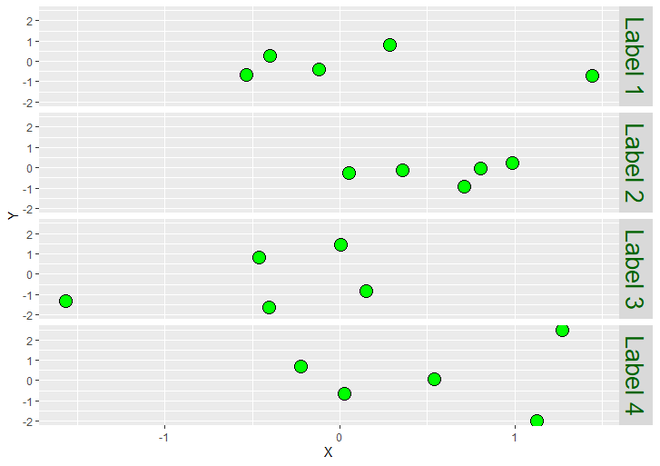
我们可以增加和减少大小。我们先来看看增加的版本。
示例 1:
电阻
library("ggplot2")

DF <- data.frame(X = rnorm(20),
                 Y = rnorm(20),
                 group = c("Label 1", "Label 2",
                           "Label 3", "Label 4"))

ggplot(DF, aes(X, Y)) +
  geom_point(size = 5, fill = "green",
             color = "black", shape = 21) +
  facet_grid(group ~ .)+
  theme(strip.text = element_text(
    size = 20, color = "dark green"))
输出 :

增加分面标签大小
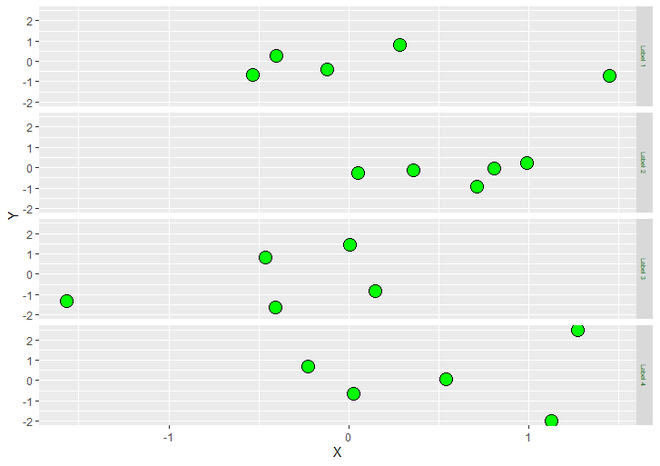
现在让我们看看减少的那个。
示例 2:
电阻
library("ggplot2")

DF <- data.frame(X = rnorm(20),
                 Y = rnorm(20),
                 group = c("Label 1", "Label 2",
                           "Label 3", "Label 4"))

ggplot(DF, aes(X, Y)) +
  geom_point(size = 5, fill = "green",
             color = "black", shape = 21) +
  facet_grid(group ~ .)+
  theme(strip.text = element_text(
    size = 5, color = "dark green"))
输出 :

缩小的刻面标签大小