使用 Pandas 在Python中进行数据操作
在机器学习中,模型需要一个数据集来操作,即训练和测试。但是数据并没有完全准备好并准备好使用。许多行和列中存在诸如“Nan”/“Null”/“NA”值之类的差异。有时数据集还包含一些在我们的模型操作中甚至不需要的行和列。在这种情况下,需要对数据集进行适当的清理和修改,以使其成为我们模型的有效输入。我们通过在将数据输入模型之前练习“数据整理”来实现这一点。
好的,让我们深入到编程部分。我们的第一个目标是在Python中创建 Pandas 数据框,您可能知道,pandas 是Python最常用的库之一。
例子:
Python3
# importing the pandas library
import pandas as pd


# creating a dataframe object
student_register = pd.DataFrame()

# assigning values to the
# rows and columns of the
# dataframe
student_register['Name'] = ['Abhijit',
                            'Smriti',
                            'Akash',
                            'Roshni']

student_register['Age'] = [20, 19, 20, 14]
student_register['Student'] = [False, True,
                               True, False]

student_register
Python3
# creating a new pandas
# series object
new_person = pd.Series(['Mansi', 19, True],
                       index = ['Name', 'Age',
                                'Student'])

# using the .append() function
# to add that row to the dataframe
student_register.append(new_person, ignore_index = True)
Python3
# for showing the dimension
# of the dataframe
print('Shape')
print(student_register.shape)

# showing info about the data
print("\n\nInfo\n")
student_register.info()

# for showing the statistical
# info of the dataframe
print("\n\nDescribe")
student_register.describe()
输出:
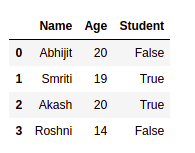
如您所见,数据框对象分别有四行 [0, 1, 2, 3] 和三列 [“Name”, “Age”, “Student”]。包含索引值的列,即 [0, 1, 2, 3] 称为索引列,它是 pandas 数据报中的默认部分。我们也可以根据我们的要求改变它,因为Python很强大。
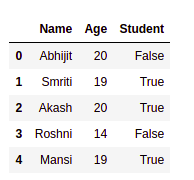
接下来,出于某种原因,我们想在数据报中添加一个新学生,即您想在现有数据框中添加一个新行,这可以通过以下代码片段来实现。
一个重要的概念是Python的“数据框”对象,由“系列”对象的行组成,它们堆叠在一起形成一个表。因此,添加一个新行意味着创建一个新的系列对象并将其附加到数据框中。
例子:
Python3
# creating a new pandas
# series object
new_person = pd.Series(['Mansi', 19, True],
                       index = ['Name', 'Age',
                                'Student'])

# using the .append() function
# to add that row to the dataframe
student_register.append(new_person, ignore_index = True)
输出:
在处理和整理任何数据之前,您需要对其进行全面了解,其中包括统计结论,如标准差 (std)、均值及其四分位数分布。此外,您需要知道每列的确切信息,即它存储的值类型以及其中有多少是唯一的。支持函数.shape、.info() 和.describe() 三个,分别输出表格的形状、行和列的信息以及数据框的统计信息(仅限数值列)。
例子:
Python3
# for showing the dimension
# of the dataframe
print('Shape')
print(student_register.shape)

# showing info about the data
print("\n\nInfo\n")
student_register.info()

# for showing the statistical
# info of the dataframe
print("\n\nDescribe")
student_register.describe()
输出:
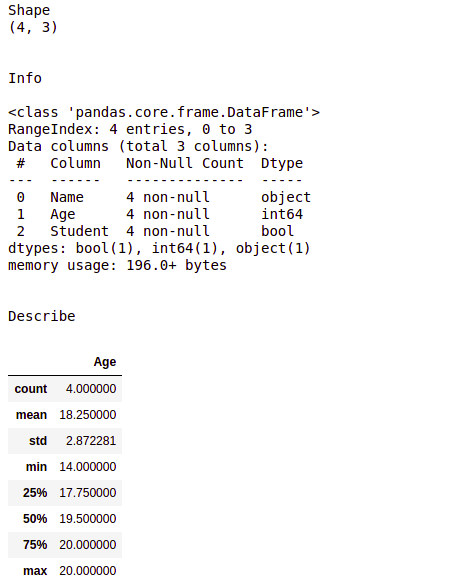
在上面的示例中,.shape函数给出了一个输出 (4, 3),因为它是创建的数据帧的大小。
.info() 方法给出的输出描述如下:
- “RangeIndex”描述了索引列,即我们数据报中的[0,1,2,3]。这是我们数据框中的行数。
- 顾名思义, “数据列”将列的总数作为输出。
- “Name”、“Age”、“Student”是我们数据中列的名称,“non-null”告诉我们在对应的列中,不存在NA/Nan/None值。 “object”、“int64”和“bool”是每列的数据类型。
- “dtype”为您提供数据报中存在多少数据类型的概览,这在术语上简化了数据清理过程。
此外,在高端机器学习模型中, “内存使用”是一个重要的术语,我们不能忽视这一点。
.describe() 方法给出的输出描述如下:
- count是数据框中的行数。
- mean是“年龄”列中所有条目的平均值。
- std是对应列的标准差。
- min和 max 分别是列中的最小和最大条目。
- 25%、50% 和 75% 分别是第一四分位数、第二四分位数(中位数)和第三四分位数,这为我们提供了有关数据集分布的重要信息,并使应用 ML 模型变得更简单。