如何在 R 中将多个数据框导出到不同的 Excel 工作表
在本文中,我们将看到如何使用 R 编程语言将多个数据框导出到不同的 Excel 工作表。
我们将使用 xlsx 模块。 xlsx 库提供 R 函数来读取/写入/格式化 Excel 文件及其格式。 xlsx 包提供对 Excel 文件的编程控制。可以修改工作表的行、列和单元格等组件,还可以设置工作表的字体、颜色和文本格式。可以将文件的内容读入数据框,也可以将数据框附加到工作表中。可以使用 R 中的以下语法将该包安装到工作空间中:
install.packages ("xlsx")方法一:使用 write.xlsx()
R 中的 write.xlsx() 方法可用于将数据框写入 Excel 工作簿。如果指定为方法第一个参数的 R 对象不是数据框,则可以将其转换为一个。
Syntax: write.xlsx(df, file, sheetName = “Sheet1”, col.names = TRUE, row.names = TRUE, append = FALSE, showNA = TRUE, password = NULL )
Arguments :
- df – the data.frame to write in the workbook.
- file – the path to the output file.
- sheetName – a name assigned to the sheet.
- col.names – indicator of whether the column names of df should be written on the file.
- row.names – indicator of whether the row names of df should be written on the file.
- append – a logical value indicating if df should be appended to an existing file.
- password – a password string.
以下代码段创建多个数据框,然后使用 write.xlsx() 方法将它们添加到同一 Excel 工作表的不同工作表中,并使用指定的文件路径名。在这种情况下,对于第二个数据框,附加属性应等于 TRUE 值,以将后续数据框添加到同一工作表中。
R
# importing required library
library("xlsx")

# creating data frame
df1 <- data.frame(col1 = c(1:3),
                  col2 = letters[1:3],
                  col3 = TRUE)
print ("Dataframe 1")
print (df1)

# creating another data frame
df2 <- data.frame(c1 = FALSE,
                  c2 = rep(1,5),
                  c3 = seq(0.1,length.out = 5,
                           by = 0.1))
print ("Dataframe 2")
print (df2)

# accessing file path
file = "/Users/yashchauhan/Desktop/gfg.xlsx"

# writing contents to xlsx sheet
write.xlsx(df1, file = file, sheetName = "sheet1",
           row.names = FALSE)

write.xlsx(df2, file= file, sheetName = "sheet2",
           append = TRUE, row.names = FALSE)
R
# importing required library
library("xlsx")
# creating data frame
df1 <- data.frame(col1 = c(1:3),
col2 = letters[1:3],
col3 = TRUE)
print ("Dataframe 1")
print (df1)
# creating another data frame
df2 <- data.frame(c1 = FALSE,
c2 = rep(1,5),
c3 = seq(0.1,length.out = 5,by=0.1))
print ("Dataframe 2")
print (df2)
# accessing file path
file = "/Users/yashchauhan/Desktop/gfg2.xlsx"
# creating workbook
wb = createWorkbook()
sht = createSheet(wb, "Sheet 1")
# add data frame
addDataFrame(df1, sheet=sht, startColumn = 1,
row.names = FALSE)
# create another sheet
sht = createSheet(wb, "Sheet 2")
# add data frame
addDataFrame(df2, sheet = sht, startColumn = 1,
row.names = FALSE)
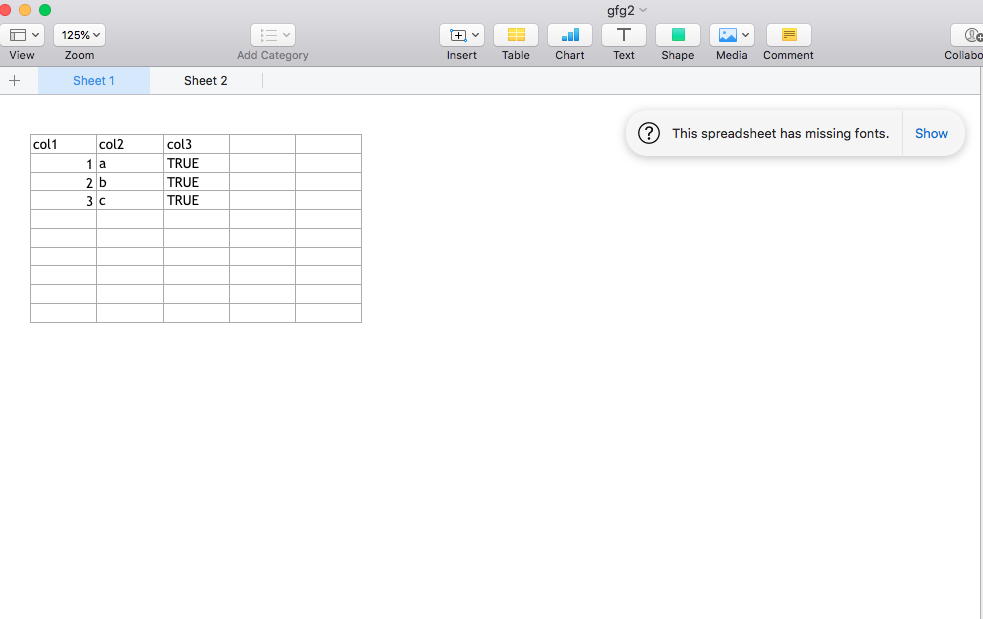
saveWorkbook(wb, file)输出:
[1] "Dataframe 1"
col1 col2 col3
1 1 a TRUE
2 2 b TRUE
3 3 c TRUE
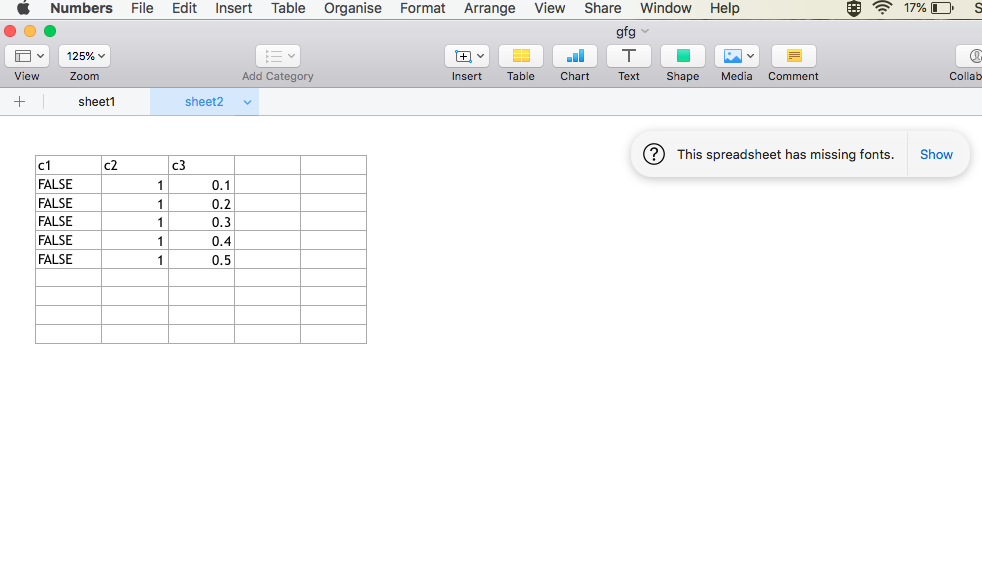
[1] "Dataframe 2"
c1 c2 c3
1 FALSE 1 0.1
2 FALSE 1 0.2
3 FALSE 1 0.3
4 FALSE 1 0.4
5 FALSE 1 0.5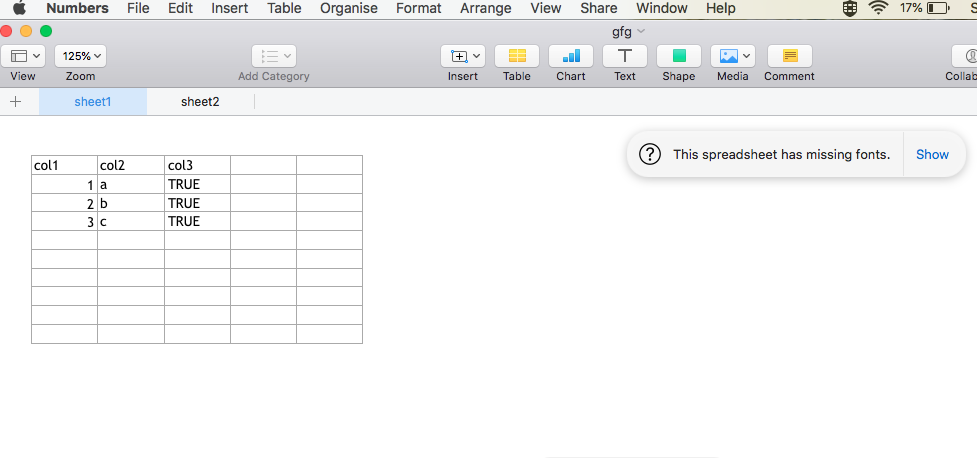
方法 2:使用 createWorkbook()
R 中的 createWorkbook() 方法用于创建一个空的工作簿对象。它返回一个Java对象,其中包含对空对象的引用。
createWorkbook(type = "xlsx")R 中的 createSheet() 方法返回创建的工作表对象。工作簿对象可用于调用 createSheet() 调用。
createSheet(wb, sheetName)R 中的 addDataFrame() 方法可用于将数据框添加到工作表,允许使用不同的列样式。这种方法比前一种方法更好,因为它也用于自定义行和列。
Syntax: addDataFrame( df , sheetName, col.names = TRUE, row.names = TRUE, startRow = 1, startColumn = 1)
Arguments :
- df – the data.frame to write in the workbook.
- sheetName – a name assigned to the sheet.
- col.names – indicator of whether the column names of df should be written on the file.
- row.names – indicator of whether the row names of df should be written on the file.
- startRow – starting row indicator.
- startColumn – starting column indicator.
然后可以使用 saveWorkbook() 方法保存工作簿,该方法具有以下语法:
saveWorkbook(wb, file, password = NULL)
代码:
电阻
# importing required library
library("xlsx")

# creating data frame
df1 <- data.frame(col1 = c(1:3),
                  col2 = letters[1:3],
                  col3 = TRUE)
print ("Dataframe 1")
print (df1)

# creating another data frame
df2 <- data.frame(c1 = FALSE,
                  c2 = rep(1,5),
                  c3 = seq(0.1,length.out = 5,by=0.1))
print ("Dataframe 2")
print (df2)

# accessing file path
file = "/Users/yashchauhan/Desktop/gfg2.xlsx"

# creating workbook
wb = createWorkbook()
sht = createSheet(wb, "Sheet 1")

# add data frame
addDataFrame(df1, sheet=sht, startColumn = 1,
             row.names = FALSE)

# create another sheet
sht = createSheet(wb, "Sheet 2")

# add data frame
addDataFrame(df2, sheet = sht, startColumn = 1,
             row.names = FALSE)

saveWorkbook(wb, file)
输出:
[1] "Dataframe 1"
col1 col2 col3
1    1    a TRUE
2    2    b TRUE
3    3    c TRUE
[1] "Dataframe 2"
c1 c2  c3
1 FALSE  1 0.1
2 FALSE  1 0.2
3 FALSE  1 0.3
4 FALSE  1 0.4
5 FALSE  1 0.5