- latex表
- latex 图
- c# latex - C# (1)
- latex 图
- LateX (1)
- c# latex - C# 代码示例
- html中的latex(1)
- latex列表(1)
- latex列表
- LateX - 任何代码示例
- 如何使用Latex(1)
- 如何使用Latex
- 安装LaTeX(1)
- 安装LaTeX
- 锈-智能指针(1)
- 锈-智能指针
- 什么是LaTeX
- 什么是LaTeX(1)
- html代码示例中的latex
- 新命令 - latex - C# (1)
- latex 图像
- latex 矩阵
- latex 矩阵(1)
- latex 颜色(1)
- latex 颜色
- 新命令 - latex - C# 代码示例
- 第N个智能号码
- 第N个智能号码(1)
- Python中的智能计算器(1)
📅 最后修改于: 2021-01-06 00:46:51 🧑 作者: Mango
latex 智能图
Latex智能图是用最少的精力制作快速图的最简便方法。它由按特定顺序排列的块的结构组成。
图中程序中使用了各种预定义样式。您需要在这些图中提及文本。
要实现图表,您首先必须加载smartdiagram程序包。 Latex或Texmaker中的软件包写为\ usepackage {smartdiagram} 。
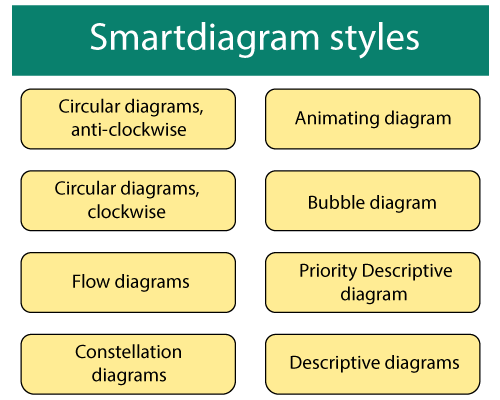
注意:默认情况下,智能图块中的颜色是默认的。您不需要指定任何特定的颜色。
1.流程图
在此示例中,?流程图字在智能图程序包中用作命令。
可以根据需要垂直或水平制作流程图。
它包含五个块。您需要提到要在这五个块中编写的文本。
I.创建简单的水平智能图的代码如下:
\documentclass[12pt]{article}
\usepackage{smartdiagram}
\begin{document}

\smartdiagram[flow diagram:horizontal]{Customer,
  Scan, Process, Implement, processed}
  % here, the five elements are mentioned together, separated by the comma. You can use any data according to the requirements.
  % the text in the above diagram is explained for your understanding. You can make any changes.

\end{document}
输出:

二。下面给出了创建垂直流程图的代码:
\documentclass[12pt]{article}
\usepackage{smartdiagram}
\begin{document}

\smartdiagram[flow diagram:vertical]{Customer,
  Scan, Process, Implement, Output}

\end{document}
输出:
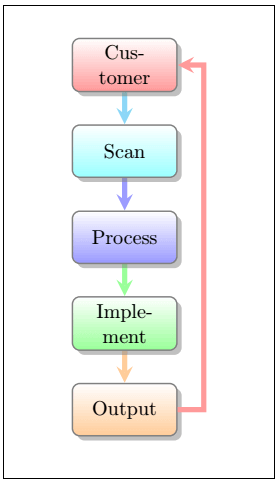
您可以根据需要修改文本。
2.圆图
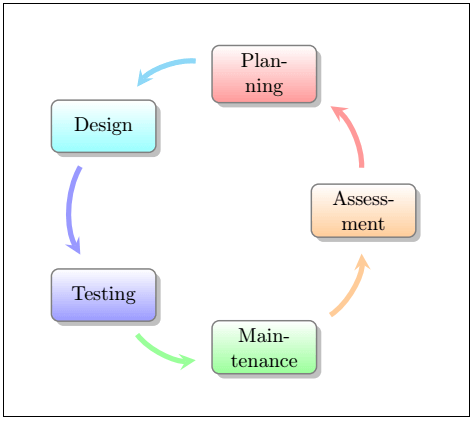
该图的形状也归类为圆形。块的形式与上图相同。
圆形图有两个方向,顺时针和逆时针。
您可以在循环图中使用许多元素。这些项目将由Latex自动调整到图中。
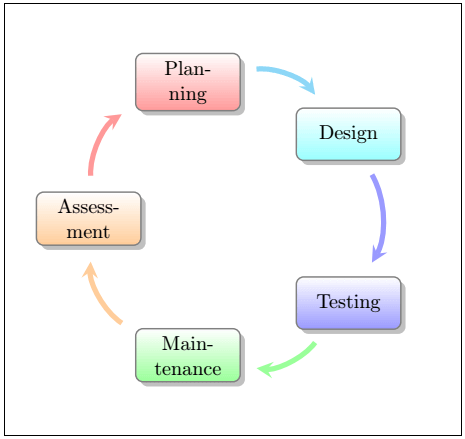
I.顺时针方向的圆形图代码如下:
\documentclass[12pt]{article}
\usepackage{smartdiagram}
\begin{document}

\smartdiagram[circular diagram:clockwise]{Planning,
  Design, Testing, Maintenance, Assessment}

\end{document}
输出:
二。逆时针方向圆形图的代码如下:
\documentclass[12pt]{article}
\usepackage{smartdiagram}
\begin{document}

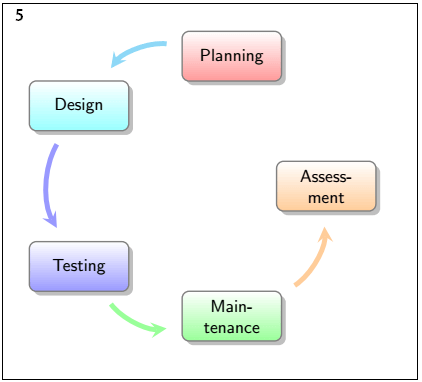
\smartdiagram[circular diagram:anticlockwise]{Planning,
  Design, Testing, Maintenance, Assessment}

\end{document}
Latex的特长在于,它不仅可以逆时针方向反转箭头的方向,而且可以更改特定图的块的方向。
您可以很快注意到以下输出中的差异:
3.气泡图
使用气泡图的概念是在主要上下文中显示一些单词。第一项放置在中心圆中,其他项放置在该中心圆周围的圆中。
气泡图略有重叠以可视化紧密关系。您需要使用\ dtklogos包来实现气泡图。
代码如下:
\documentclass{beamer}
\usepackage{smartdiagram}
\begin{document}

    \smartdiagram[bubble diagram]{ Passive Components, Inductors, Capacitors, Resistors, Transformers}
   % here, the first element is placed at the center, and rest elements are places around that circle in the form of bubbles.

 \end{document}
输出:
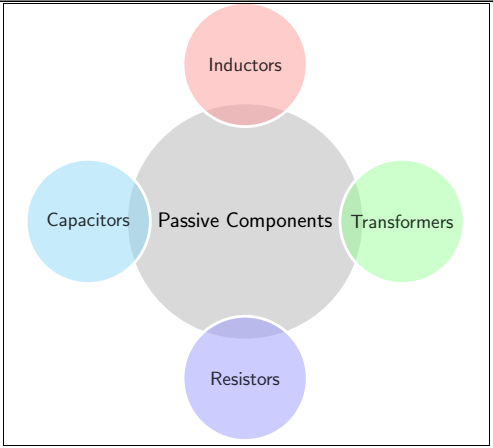
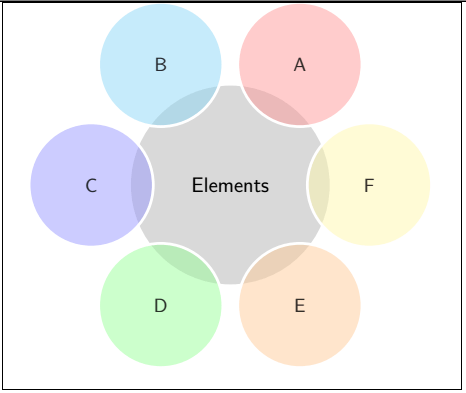
您可以在中心圆周围使用尽可能多的元素。上面的示例在中心圆周围包含四个元素。
让我们考虑一个包含六个元素的示例。
下面给出了创建具有六个元素的图的代码:
\documentclass{beamer}
\usepackage{smartdiagram}
\begin{document}

\smartdiagram[bubble diagram]{ Elements, A, B, C, D, E, F}

 \end{document}
输出:
4.描述图
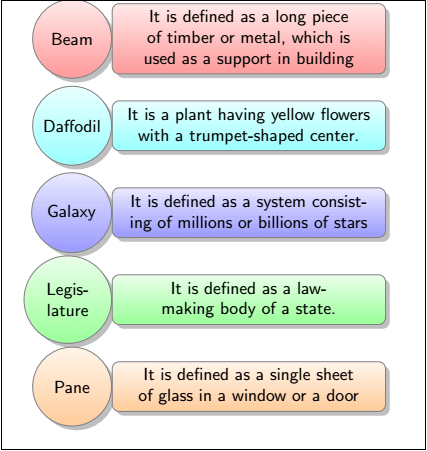
描述图用于安排带有说明的项目。项目列表是一个以圆圈形式表示的小列表。特定项目的描述性列表以方框形式或以矩形形式描述。
大括号用于表示代码中的项目及其描述。
下面的示例给出了用于创建描述图的代码:
\documentclass{beamer} % beamer class is used commonly for animating the diagram
\usepackage{smartdiagram}
\begin{document}

 \smartdiagram[descriptive diagram]{
 {Beam,{ It is defined as a long piece of timber or metal, which is used as a support in building}},
 {Daffodil, {It is a plant having yellow flowers with a trumpet-shaped center.}},
 {Galaxy, {It is defined as a system consisting of millions or billions of stars}},
 {Legislature, {It is defined as a law-making body of a state.}},
 {Pane, {It is defined as a single sheet of glass in a window or a door}},
 }
% here, the first word is an item, and after the comma is its description. You can use any data and any number of items with their descriptions according to the requirements.

 \end{document}
输出:
5.星座图
星座图与其他图不同。第一项是放置在中心圆中的项。其他项目也放置在连接中心的彩色圆圈内。
中心项目和外部项目之间的关系以箭头的形式显示。外部环境中的每个项目都与中心项目相关。
让我们考虑一个例子来理解这一点。这种模型的代码如下:
\documentclass[12pt]{article}
\usepackage{smartdiagram}
\begin{document}

\smartdiagram[constellation diagram]{Cloud Types, Stratus Clouds,
  Cumulus Clouds, Nimbus Clouds, Cirrus Clouds}

 \end{document}
输出:
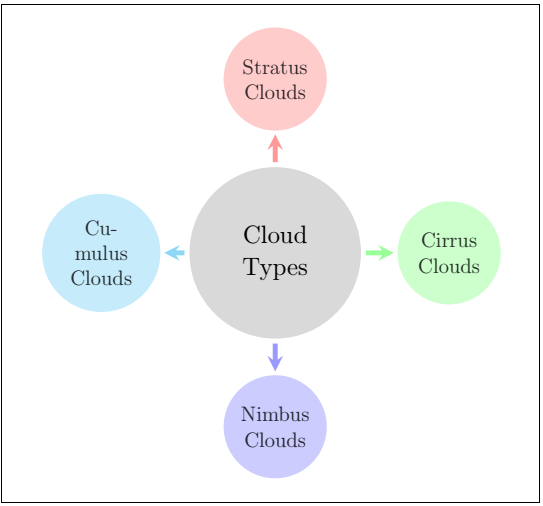
您可以根据要求考虑任何示例。上面的示例只是为了使您更好地理解每种类型的样式。
6.优先描述图
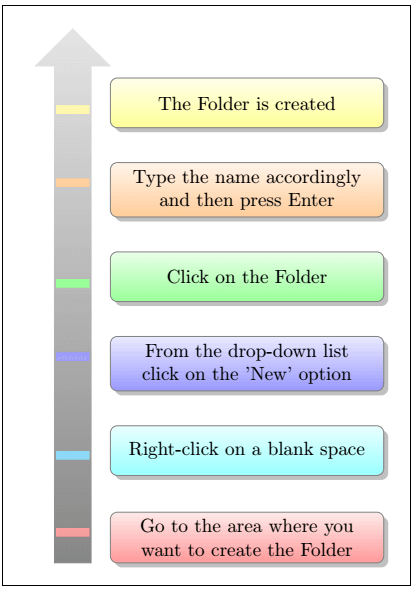
优先级描述图用于强调描述图的特定顺序。
代码中写入的第一项将是图的底部,而代码的最后一个元素将是图的顶部。
让我们考虑一个例子来理解这一点。该案例将是一个模型,其中包含在计算机屏幕上创建文件夹的步骤。
下面给出了该示例的代码:
\documentclass[12pt]{article}
\usepackage{smartdiagram}
\begin{document}

\smartdiagram[priority descriptive diagram]{
Go to the area where you want to create the Folder, % this element will appear at the bottom in the output diagram
Right-click on a blank space,
From the drop-down list click on the 'New' option,
Click on the Folder,
Type the name accordingly and then press Enter,
The Folder is created} % this element will appear at the top in the output diagram
 % the comma should not be present at the end of the last element. Otherwise, the Latex will consider another blank box after the final or top box

\end{document}
输出:
7.动画图
动画图代替smartdiagram命令中使用smartdiagramanimated。
它以智能图动画形式{图表样式的名称}编写。
框架环境用于逐步构建图表。该环境写为:
\begin{frame}
......
\end{frame}
在文档环境之后提到该环境。
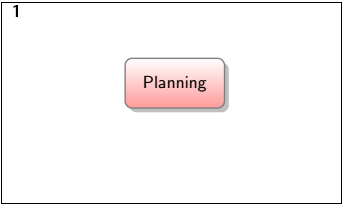
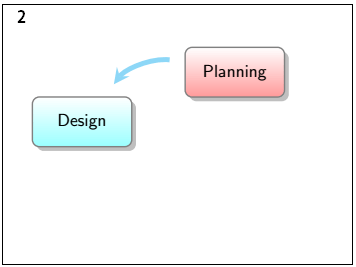
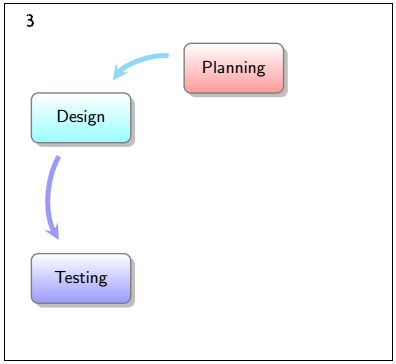
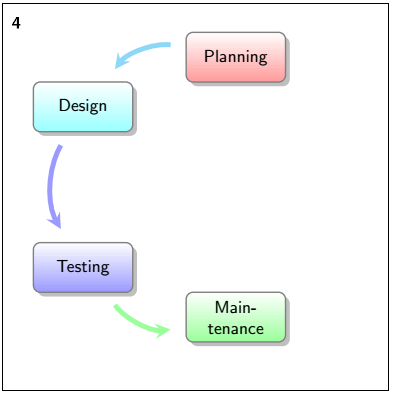
它将图分为多个步骤,每个步骤都在单独的页面上提到。例如,如果图片或图表中有六个块,则输出将包含七个页面。
输出页面将为n + 1 ,其中n是块数。
额外的步骤用于完成特定图的表示。
第一页将包括第一步,第二页将包括第一步和第二步。第三页将包括第三步以及第一步和第二步,依此类推。
让我们考虑与循环图中提到的代码相同的代码。
为了更好地理解,下面给出了示例:
在此图中,使用了五个块。您可以根据要求使用任何样式和任意数量的块。
\documentclass{beamer} % the beamer class is used to animate the diagram easily.
\usepackage{smartdiagram}
\begin{document}
\begin{frame}

\smartdiagramanimated[circular diagram]{Planning,
  Design, Testing, Maintenance, Assessment}

\end{frame}
\end{document}
输出将为六页,并显示在以下六个图像中。
我们已对所有六个图像进行编号,以便您更好地理解。
