Numpy Meshgrid函数
numpy.meshgrid函数用于从表示笛卡尔索引或矩阵索引的两个给定一维数组中创建一个矩形网格。 Meshgrid函数的灵感来自 MATLAB。
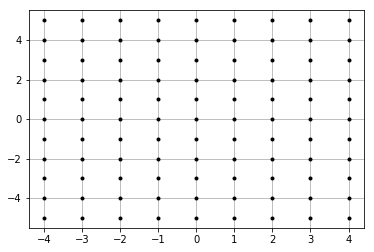
考虑上图,X 轴范围从 -4 到 4,Y 轴范围从 -5 到 5。所以图中总共有 (9 * 11) = 99 个点,每个点都有一个 X 坐标和一个 Y 坐标。对于任何平行于X轴的直线,标记点的X坐标分别为-4、-3、-2、-1、0、1、2、3、4。另一方面,对于任意直线与 Y 轴平行,标记点的 Y 坐标从下到上分别为 -5, -4, -3, -2, -1, 0, 1, 2, 3, 4, 5。 meshgrid函数返回两个二维数组,表示所有点的 X 和 Y 坐标。

例子:
Input : x = [-4, -3, -2, -1, 0, 1, 2, 3, 4]
        y = [-5, -4, -3, -2, -1, 0, 1, 2, 3, 4, 5]
Output :
x_1 = array([[-4., -3., -2., -1.,  0.,  1.,  2.,  3.,  4.],
             [-4., -3., -2., -1.,  0.,  1.,  2.,  3.,  4.],
             [-4., -3., -2., -1.,  0.,  1.,  2.,  3.,  4.],
             [-4., -3., -2., -1.,  0.,  1.,  2.,  3.,  4.],
             [-4., -3., -2., -1.,  0.,  1.,  2.,  3.,  4.],
             [-4., -3., -2., -1.,  0.,  1.,  2.,  3.,  4.],
             [-4., -3., -2., -1.,  0.,  1.,  2.,  3.,  4.],
             [-4., -3., -2., -1.,  0.,  1.,  2.,  3.,  4.],
             [-4., -3., -2., -1.,  0.,  1.,  2.,  3.,  4.],
             [-4., -3., -2., -1.,  0.,  1.,  2.,  3.,  4.],
             [-4., -3., -2., -1.,  0.,  1.,  2.,  3.,  4.]])

y_1 = array([[-5., -5., -5., -5., -5., -5., -5., -5., -5.],
       [-4., -4., -4., -4., -4., -4., -4., -4., -4.],
       [-3., -3., -3., -3., -3., -3., -3., -3., -3.],
       [-2., -2., -2., -2., -2., -2., -2., -2., -2.],
       [-1., -1., -1., -1., -1., -1., -1., -1., -1.],
       [ 0.,  0.,  0.,  0.,  0.,  0.,  0.,  0.,  0.],
       [ 1.,  1.,  1.,  1.,  1.,  1.,  1.,  1.,  1.],
       [ 2.,  2.,  2.,  2.,  2.,  2.,  2.,  2.,  2.],
       [ 3.,  3.,  3.,  3.,  3.,  3.,  3.,  3.,  3.],
       [ 4.,  4.,  4.,  4.,  4.,  4.,  4.,  4.,  4.],
       [ 5.,  5.,  5.,  5.,  5.,  5.,  5.,  5.,  5.]])


Input : x = [0, 1, 2, 3, 4, 5]
        y = [2, 3, 4, 5, 6, 7, 8]

Output :
x_1 = array([[0., 1., 2., 3., 4., 5.],
             [0., 1., 2., 3., 4., 5.],
             [0., 1., 2., 3., 4., 5.],
             [0., 1., 2., 3., 4., 5.],
             [0., 1., 2., 3., 4., 5.],
             [0., 1., 2., 3., 4., 5.],
             [0., 1., 2., 3., 4., 5.]])

y_1 = array([[2., 2., 2., 2., 2., 2.],
             [3., 3., 3., 3., 3., 3.],
             [4., 4., 4., 4., 4., 4.],
             [5., 5., 5., 5., 5., 5.],
             [6., 6., 6., 6., 6., 6.],
             [7., 7., 7., 7., 7., 7.],
             [8., 8., 8., 8., 8., 8.]]
下面是代码:
Python3
# Sample code for generation of first example
import numpy as np
# from matplotlib import pyplot as plt
# pyplot imported for plotting graphs

x = np.linspace(-4, 4, 9)

# numpy.linspace creates an array of
# 9 linearly placed elements between
# -4 and 4, both inclusive
y = np.linspace(-5, 5, 11)

# The meshgrid function returns
# two 2-dimensional arrays
x_1, y_1 = np.meshgrid(x, y)

print("x_1 = ")
print(x_1)
print("y_1 = ")
print(y_1)
Python3
ellipse = xx * 2 + 4 * yy**2
plt.contourf(x_1, y_1, ellipse, cmap = 'jet')

plt.colorbar()
plt.show()
Python3
random_data = np.random.random((11, 9))
plt.contourf(x_1, y_1, random_data, cmap = 'jet')

plt.colorbar()
plt.show()
Python3
sine = (np.sin(x_1**2 + y_1**2))/(x_1**2 + y_1**2)
plt.contourf(x_1, y_1, sine, cmap = 'jet')

plt.colorbar()
plt.show()
Python3
# Sample code for generation of Matrix indexing
import numpy as np


x = np.linspace(-4, 4, 9)
# numpy.linspace creates an array
# of 9 linearly placed elements between
# -4 and 4, both inclusive
y = np.linspace(-5, 5, 11)

# The meshgrid function returns
# two 2-dimensional arrays
x_1, y_1 = np.meshgrid(x, y)


x_2, y_2 = np.meshgrid(x, y, indexing = 'ij')

# The following 2 lines check if x_2 and y_2 are the
# transposes of x_1 and y_1 respectively
print("x_2 = ")
print(x_2)
print("y_2 = ")
print(y_2)

# np.all is Boolean and operator;
# returns true if all holds true.
print(np.all(x_2 == x_1.T))
print(np.all(y_2 == y_1.T))x_1 =
[[-4. -3. -2. -1. 0. 1. 2. 3. 4.]
[-4. -3. -2. -1. 0. 1. 2. 3. 4.]
[-4. -3. -2. -1. 0. 1. 2. 3. 4.]
[-4. -3. -2. -1. 0. 1. 2. 3. 4.]
[-4. -3. -2. -1. 0. 1. 2. 3. 4.]
[-4. -3. -2. -1. 0. 1. 2. 3. 4.]
[-4. -3. -2. -1. 0. 1. 2. 3. 4.]
[-4. -3. -2. -1. 0. 1. 2. 3. 4.]
[-4. -3. -2. -1. 0. 1. 2. 3. 4.]
[-4. -3. -2. -1. 0. 1. 2. 3. 4.]
[-4. -3. -2. -1. 0. 1. 2. 3. 4.]]
y_1 =
[[-5. -5. -5. -5. -5. -5. -5. -5. -5.]
[-4. -4. -4. -4. -4. -4. -4. -4. -4.]
[-3. -3. -3. -3. -3. -3. -3. -3. -3.]
[-2. -2. -2. -2. -2. -2. -2. -2. -2.]
[-1. -1. -1. -1. -1. -1. -1. -1. -1.]
[ 0. 0. 0. 0. 0. 0. 0. 0. 0.]
[ 1. 1. 1. 1. 1. 1. 1. 1. 1.]
[ 2. 2. 2. 2. 2. 2. 2. 2. 2.]
[ 3. 3. 3. 3. 3. 3. 3. 3. 3.]
[ 4. 4. 4. 4. 4. 4. 4. 4. 4.]
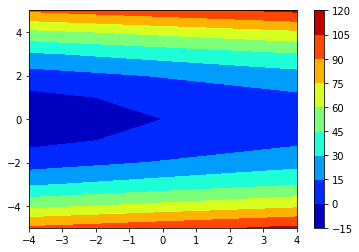
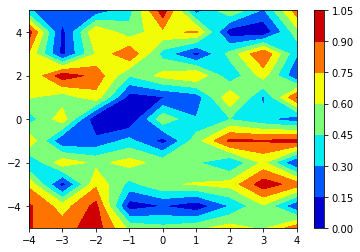
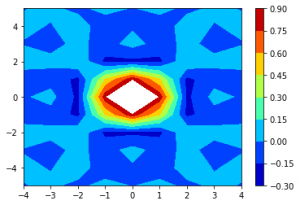
[ 5. 5. 5. 5. 5. 5. 5. 5. 5.]] meshgrid 输出的坐标也可用于在给定坐标范围内绘制函数。
椭圆:
*** QuickLaTeX cannot compile formula:


*** Error message:
Error: Nothing to show, formula is empty
Python3
ellipse = xx * 2 + 4 * yy**2
plt.contourf(x_1, y_1, ellipse, cmap = 'jet')

plt.colorbar()
plt.show()
输出:

随机数据:
Python3
random_data = np.random.random((11, 9))
plt.contourf(x_1, y_1, random_data, cmap = 'jet')

plt.colorbar()
plt.show()
输出:

正弦函数:
*** QuickLaTeX cannot compile formula:


*** Error message:
Error: Nothing to show, formula is empty
Python3
sine = (np.sin(x_1**2 + y_1**2))/(x_1**2 + y_1**2)
plt.contourf(x_1, y_1, sine, cmap = 'jet')

plt.colorbar()
plt.show()
输出:

我们观察到 x_1 是行重复矩阵,而 y_1 是列重复矩阵。一行 x_1 和一列 y_1 足以确定所有点的位置,因为其他值将一遍又一遍地重复。所以我们可以编辑上面的代码如下:
x_1, y_1 = np.meshgrid(x, y, sparse = True)
这将产生以下输出:
x_1 = [[-4. -3. -2. -1.  0.  1.  2.  3.  4.]]
y_1 = [[-5.]
 [-4.]
 [-3.]
 [-2.]
 [-1.]
 [ 0.]
 [ 1.]
 [ 2.]
 [ 3.]
 [ 4.]
 [ 5.]]
x_1 的形状由 (11, 9) 变为 (1, 9),y_1 的形状由 (11, 9) 变为 (11, 1)
然而,Matrix 的索引是不同的。实际上,它与笛卡尔索引完全相反。

对于上面显示的矩阵,对于给定的行,Y 坐标从左到右增加为 0、1、2、3,而对于给定的列,X 坐标从上到下增加为 0、1、2。
从 Matrix 索引返回的两个二维数组将是前面程序生成的数组的转置。以下代码可用于获取 Matrix 索引:
Python3
# Sample code for generation of Matrix indexing
import numpy as np


x = np.linspace(-4, 4, 9)
# numpy.linspace creates an array
# of 9 linearly placed elements between
# -4 and 4, both inclusive
y = np.linspace(-5, 5, 11)

# The meshgrid function returns
# two 2-dimensional arrays
x_1, y_1 = np.meshgrid(x, y)


x_2, y_2 = np.meshgrid(x, y, indexing = 'ij')

# The following 2 lines check if x_2 and y_2 are the
# transposes of x_1 and y_1 respectively
print("x_2 = ")
print(x_2)
print("y_2 = ")
print(y_2)

# np.all is Boolean and operator;
# returns true if all holds true.
print(np.all(x_2 == x_1.T))
print(np.all(y_2 == y_1.T))
x_2 =
[[-4. -4. -4. -4. -4. -4. -4. -4. -4. -4. -4.]
 [-3. -3. -3. -3. -3. -3. -3. -3. -3. -3. -3.]
 [-2. -2. -2. -2. -2. -2. -2. -2. -2. -2. -2.]
 [-1. -1. -1. -1. -1. -1. -1. -1. -1. -1. -1.]
 [ 0.  0.  0.  0.  0.  0.  0.  0.  0.  0.  0.]
 [ 1.  1.  1.  1.  1.  1.  1.  1.  1.  1.  1.]
 [ 2.  2.  2.  2.  2.  2.  2.  2.  2.  2.  2.]
 [ 3.  3.  3.  3.  3.  3.  3.  3.  3.  3.  3.]
 [ 4.  4.  4.  4.  4.  4.  4.  4.  4.  4.  4.]]
y_2 =
[[-5. -4. -3. -2. -1.  0.  1.  2.  3.  4.  5.]
 [-5. -4. -3. -2. -1.  0.  1.  2.  3.  4.  5.]
 [-5. -4. -3. -2. -1.  0.  1.  2.  3.  4.  5.]
 [-5. -4. -3. -2. -1.  0.  1.  2.  3.  4.  5.]
 [-5. -4. -3. -2. -1.  0.  1.  2.  3.  4.  5.]
 [-5. -4. -3. -2. -1.  0.  1.  2.  3.  4.  5.]
 [-5. -4. -3. -2. -1.  0.  1.  2.  3.  4.  5.]
 [-5. -4. -3. -2. -1.  0.  1.  2.  3.  4.  5.]
 [-5. -4. -3. -2. -1.  0.  1.  2.  3.  4.  5.]]

True

True
sparse = True 也可以在Matrix indexing的meshgrid函数中加入。在这种情况下,x_2 的形状将从 (9, 11) 变为 (9, 1),y_2 的形状将从 (9, 11) 变为 (1, 11)。