如何在 R 中创建分组条形图?
在本文中,我们将讨论如何在 R 编程语言中创建分组条形图。
方法 1:在 Base R 中创建分组条形图
在这种创建分组条形图的方法中,用户只需要使用 R 语言的基本功能即可。用户需要首先将用于创建条形图的数据相应地修改为不同的组,然后必须调用 barplot()函数并传入所需的参数,以分别在 R 编程语言中创建给定数据的条形图。
Barplot()函数:此函数用于创建带有垂直或水平条的条形图。
Syntax: barplot(height, beside = FALSE,… )
Parameters:
- height: either a vector or matrix of values describing the bars which make up the plot. I
- beside: a logical value. If FALSE, the columns of height are portrayed as stacked bars, and if TRUE the columns are portrayed as juxtaposed bars.
- …: arguments to be passed to/from other methods.
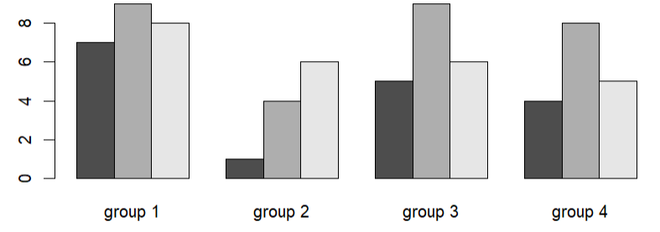
示例:在此示例中,我们将在基础 R 中创建四个不同组的分组条形图。
R
# Create data
gfg <- data.frame(x = c(7,9,8,1,4,6,5,9,6,4,8,5),
                   grp = rep(c("group 1", "group 2",
                               "group 3","group 4"),
                               each = 3),
                   subgroup = LETTERS[1:3])
# Modifying data
gfg <- reshape(gfg,idvar = "subgroup",
               timevar = "grp",
               direction = "wide")

row.names(gfg) <- gfg$subgroup
gfg <- gfg[ , 2:ncol(gfg)]
colnames(gfg) <- c("group 1", "group 2",
                   "group 3","group 4")
gfg <- as.matrix(gfg)

# Create grouped barplot
barplot(height = gfg,beside = TRUE)
R
# Import ggplot2
library(ggplot2)

# Create data
gfg <- data.frame(x = c(7,9,8,1,4,6,5,9,6,4,8,5),
                   grp = rep(c("group 1", "group 2",
                               "group 3","group 4"),
                               each = 3),
                   subgroup = LETTERS[1:3])

# Create grouped barplot using ggplot2
ggplot(gfg,aes(x = grp, y =x, fill = subgroup)) +
geom_bar(stat = "identity", position = "dodge")
R
# Import lattice
library(lattice)

# Create data
gfg <- data.frame(x = c(7,9,8,1,4,6,5,9,6,4,8,5),
                  grp = rep(c("group 1", "group 2",
                              "group 3","group 4"),
                            each = 3),
                  subgroup = LETTERS[1:3])

# Create grouped barplot using lattice
barchart(x ~ grp, data = gfg, groups = subgroup)
输出:
方法 2:使用 ggplot2 包创建分组条形图
在这种创建分组条形图的方法中,用户首先需要在工作的 r 控制台中安装和导入 ggplot2 包,这里 ggplot2 负责导入其用于创建分组条形图的函数。然后,用户需要调用 ggplot 包中的 geom_bar()函数并将所需参数放入其中,以在 R 编程语言中创建分组条形图。
在工作 R 控制台中安装和导入 ggplot 包的语法:
install.package('ggplot2') #To Install
library(ggplot2) #To Importgeom_bar()函数:此函数使条形的高度与每组中的案例数成正比。
Syntax: geom_bar( mapping = NULL, data = NULL, stat = “count”, position = “stack”, …,)
Parameters:
- mapping: Set of aesthetic mappings created by aes() or aes_(). If specified and inherit.aes = TRUE (the default), it is combined with the default mapping at the top level of the plot.
- data: The data to be displayed in this layer.
- position: Position adjustment, either as a string, or the result of a call to a position adjustment function.
- stat: Override the default connection.
- …: Other arguments passed.
例子:
R
# Import ggplot2
library(ggplot2)

# Create data
gfg <- data.frame(x = c(7,9,8,1,4,6,5,9,6,4,8,5),
                   grp = rep(c("group 1", "group 2",
                               "group 3","group 4"),
                               each = 3),
                   subgroup = LETTERS[1:3])

# Create grouped barplot using ggplot2
ggplot(gfg,aes(x = grp, y =x, fill = subgroup)) +
geom_bar(stat = "identity", position = "dodge")
输出:
方法 3:使用 lattice 包创建分组条形图
在这种创建分组条形图的方法中,用户首先需要在工作的 R 控制台中安装和导入 lattice 包,然后用户需要从 lattice 包中调用 barchart()函数并将该函数与各自的参数传递给它以 R 编程语言获取分组的条形图。
在工作 R 控制台中安装和导入 lattice 包的语法:
install.package('lattice ') #To Install
library(lattice) #To ImportBarchart:此函数用于绘制条形图。
Syntax: barchart(formula, data = parent.frame(), panel = panel.barchart, box.ratio =2, …)
Parameters:
- formula: a formula describing the form of the conditioning plot. A formula of the form y ~ x | g1 * g2 * … indicates that plots of y versus x should be produced conditional on the variable g1,g2,….
- panel: panel function to be used to draw panels
- data: data frame for the variables in the formula etc
- box.ratio: ratio of bar width to inter bar width
- …: other arguments
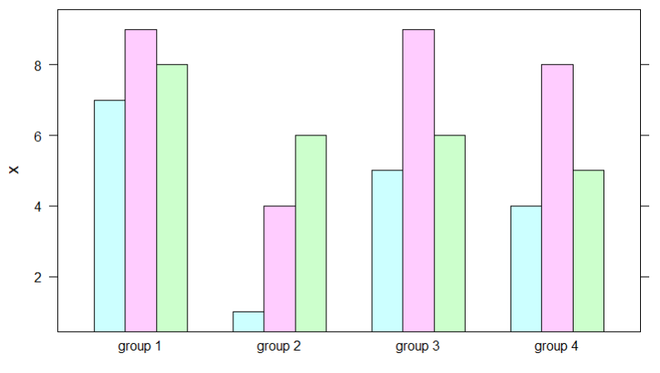
示例:在此示例中,我们将使用 R 编程语言中 lattice 包中的 barchart()函数创建分组条形图。
R
# Import lattice
library(lattice)

# Create data
gfg <- data.frame(x = c(7,9,8,1,4,6,5,9,6,4,8,5),
                  grp = rep(c("group 1", "group 2",
                              "group 3","group 4"),
                            each = 3),
                  subgroup = LETTERS[1:3])

# Create grouped barplot using lattice
barchart(x ~ grp, data = gfg, groups = subgroup)
输出:


