有了本文,您就可以开始学习ML算法,概念,数学和编码。
为了使用ML代码,库在Python扮演着非常重要的角色,我们将对其进行详细研究,但让我们对最重要的一个简短的描述:
- NumPy的(数值的Python):这是Python的最大的科学和数学运算库之一。诸如Keras,Tensorflow之类的平台已在Tensor上嵌入了Numpy操作。我们关心的功能是它的强大功能,以及易于在Array上处理和执行操作的功能。
- 熊猫:这个包在处理数据时非常有用。这使得操作,聚集和可视化数据变得非常容易。
- MatplotLib:该库简化了功能强大且非常简单的可视化任务。
还有更多的库,但是现在没有用了。所以,让我们开始吧。
下载数据集:
转到链接并下载Data_for_Missing_Values.csv 。
水蟒
我建议你们在系统上安装Anaconda。在您的系统上启动Spyder我们的Jupyter。建议这样做的原因是– Anaconda已预先安装了所有基本的Python库。 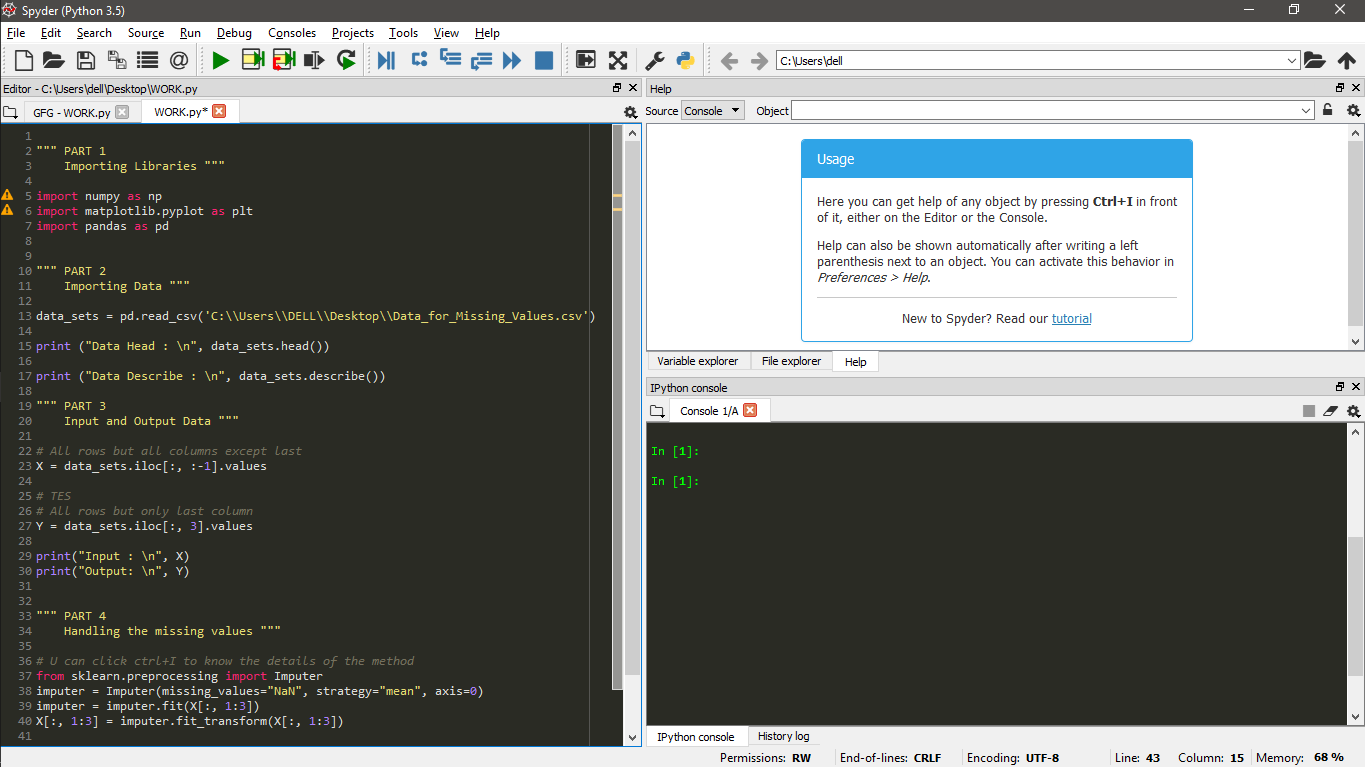
以下是Python代码:
# Python code explaining How to
# Handle Missing Value in Dataset

""" PART 1
    Importing Libraries """

import numpy as np
import matplotlib.pyplot as plt
import pandas as pd


""" PART 2
    Importing Data """

data_sets = pd.read_csv('C:\\Users\\Admin\\Desktop\\Data_for_Missing_Values.csv')

print ("Data Head : \n", data_sets.head())

print ("\n\nData Describe : \n", data_sets.describe())

""" PART 3
    Input and Output Data """

# All rows but all columns except last
X = data_sets.iloc[:, :-1].values

# TES
# All rows but only last column
Y = data_sets.iloc[:, 3].values

print("\n\nInput : \n", X)
print("\n\nOutput: \n", Y)


""" PART 4
    Handling the missing values """

# We will use sklearn library >> preprocessing package
# Imputer class of that package
from sklearn.preprocessing import Imputer

# Using Imputer function to replace NaN
# values with mean of that parameter value
imputer = Imputer(missing_values = "NaN",
                  strategy = "mean", axis = 0)

# Fitting the data, function learns the stats
imputer = imputer.fit(X[:, 1:3])

# fit_transform() will execute those
# stats on the input ie. X[:, 1:3]
X[:, 1:3] = imputer.fit_transform(X[:, 1:3])

# filling the missing value with mean
print("\n\nNew Input with Mean Value for NaN : \n", X)
输出 :
Data Head :
    Country   Age   Salary Purchased
0   France  44.0  72000.0        No
1    Spain  27.0  48000.0       Yes
2  Germany  30.0  54000.0        No
3    Spain  38.0  61000.0        No
4  Germany  40.0      NaN       Yes


Data Describe :
              Age        Salary
count   9.000000      9.000000
mean   38.777778  63777.777778
std     7.693793  12265.579662
min    27.000000  48000.000000
25%    35.000000  54000.000000
50%    38.000000  61000.000000
75%    44.000000  72000.000000
max    50.000000  83000.000000


Input :
 [['France' 44.0 72000.0]
 ['Spain' 27.0 48000.0]
 ['Germany' 30.0 54000.0]
 ['Spain' 38.0 61000.0]
 ['Germany' 40.0 nan]
 ['France' 35.0 58000.0]
 ['Spain' nan 52000.0]
 ['France' 48.0 79000.0]
 ['Germany' 50.0 83000.0]
 ['France' 37.0 67000.0]]


Output:
 ['No' 'Yes' 'No' 'No' 'Yes' 'Yes' 'No' 'Yes' 'No' 'Yes']


New Input with Mean Value for NaN :
 [['France' 44.0 72000.0]
 ['Spain' 27.0 48000.0]
 ['Germany' 30.0 54000.0]
 ['Spain' 38.0 61000.0]
 ['Germany' 40.0 63777.77777777778]
 ['France' 35.0 58000.0]
 ['Spain' 38.77777777777778 52000.0]
 ['France' 48.0 79000.0]
 ['Germany' 50.0 83000.0]
 ['France' 37.0 67000.0]]
代码说明:
- 第1部分–导入库:在上面的代码中,导入了numpy,pandas和matplotlib,但我们仅使用了pandas。
- 第2部分–导入数据:
- 通过提供熊猫read_csv函数的路径来导入
Data_for_Missing_Values.csv。现在,“ data_sets”是一个DataFrame(带有标签行和列的二维表格数据结构)。 - 然后使用head()函数打印数据帧的前5个数据条目。条目数可以更改,例如对于前3个值,我们可以使用dataframe.head(3)。同样,也可以使用tail()函数最后一个值。
- 然后使用describe()函数。它给出了数据的统计摘要,其中包括每个参数值的最小值,最大值,百分位数(.25,.5,.75),均值和标准差。
- 通过提供熊猫read_csv函数的路径来导入
- 第3部分–输入和输出数据:我们将数据框拆分为输入和输出。
- 第4部分–处理缺失值:使用sklearn.preprocessing包中的Imputer()函数。
功率:
Imputer(missing_values='NaN', strategy='mean', axis=0, verbose=0, copy=True)是从Imputer类sklearn.preprocessing包的函数。它的作用是将参数值从缺失值(NaN)转换为战略值。
Syntax : sklearn.preprocessing.Imputer()

Parameters :

-> missing_values  : integer or “NaN”
-> strategy        : What to impute - mean, median or most_frequent along axis
-> axis(default=0) : 0 means along column and 1 means along row