在 R 中的 ggplot2 中的单个方面注释文本
在本文中,我们将讨论如何在 R 编程语言中的 ggplot2 中的 Individual facet 上注释文本。
要在 R 编程语言中绘制 facet,我们使用ggplot2库中的facet_grid()函数。 facet_grid()用于形成由行和列分面变量定义的面板矩阵,即显示数据中存在的变量的所有组合。标注文字和标注文字有些类似,但标注和标注的区别在于我们一般不能改变标注的位置和属性,而标注文字时没有这样的预定义规则。注释是关于图形的附加元数据,标签是用于识别图形的关于图形的一条信息。
Syntax: facet_grid(rows = NULL,cols = NULL,scales = “fixed”,space = “fixed”,shrink = TRUE,..)
Parameters:
- rows, cols: Used for defining faceting groups on the rows or columns dimension.
- scales: To set scales sharing across all facets. The default is “fixed” which means all scales are shared across all facets. If they vary across rows then scales are set to be “free_x”, to vary across columns it is set to be “free_y”, and for both rows and columns, it is set to be “free”.
- space: To set the size of the panel. By default, it is set to be “fixed” i.e. all panels have the same size. If it is set to be “free_y” then their height will be proportional to the length of the y scale, if it is set to be “free_x” then their width will be proportional to the length of the x scale and if it is set to be “free” then both height and width will vary.
- shrink: It is used to fit the output of the statistics result to the screen, by default it is true.
首先,加载并安装绘制facet所需的必要库,即加载ggplot2库并创建一个虚拟数据集。
使用中的数据集:
Name Gender Price
1     A      M     1
2     B      M     2
3     C      F     3
4     D      F     4
5     E      M     5
通过将数据框作为参数传递,使用 ggplot 命令绘制数据。让我们先看看没有注释的情节,这样差异就很明显了。
示例:在单个方面不带注释文本的绘图。
R
# Facet before adding Annotating text

# installing ggplot2 library
install.packages("ggplot2")

# loading the library
library("ggplot2")

# creating a dummy dataset
people <- c("A","B","C","D","E")
gender <- c("M","M","F","F","M")
price <- c(1,2,3,4,5)

df <- data.frame(Name = people, Gender = gender, Price = price)

# plotting the data using ggplot
plt <- ggplot(

    # providing dataset
    df,

    # to plot price vs Gender
    aes(x=Price, y=Gender)

    # to plot data point as a (.) dot
) + geom_point()

# creating facet from Gender and Price variable
plt <- plt + facet_grid(Gender ~ Price)

# displaying facet plot
plt
R
# Annotating text on individual facet in ggplot2

# installing ggplot2 library
install.packages("ggplot2")

# loading the library
library("ggplot2")

# creating a dummy dataset
people <- c("A","B","C","D","E")
gender <- c("M","M","F","F","M")
price <- c(1,2,3,4,5)

df <- data.frame(Name = people, Gender = gender, Price = price)

# plotting the data using ggplot
plt <- ggplot(

    # providing dataset
    df,

    # to plot price vs Gender
    aes(x=Price, y=Gender)

    # to plot data point as a (.) dot
) + geom_point()


# creating a dataframe for annotating text
ann_dat_text<-data.frame(

    # Providing F as an annotation of Plot 1
    # and M as an annotation of Plot 2
    Gender=c("F","M"),
    Price=c(3,4),
    label=c("Plot 1","Plot 2")
)

# creating facet from Gender and Price variable
plt <- plt + facet_grid(Gender ~ Price)

# annotating the graph with the custom label made
plt + geom_text(

    # the new dataframe for annotating text
    data = ann_dat_text,
    label=ann_dat_text$label
)
输出:
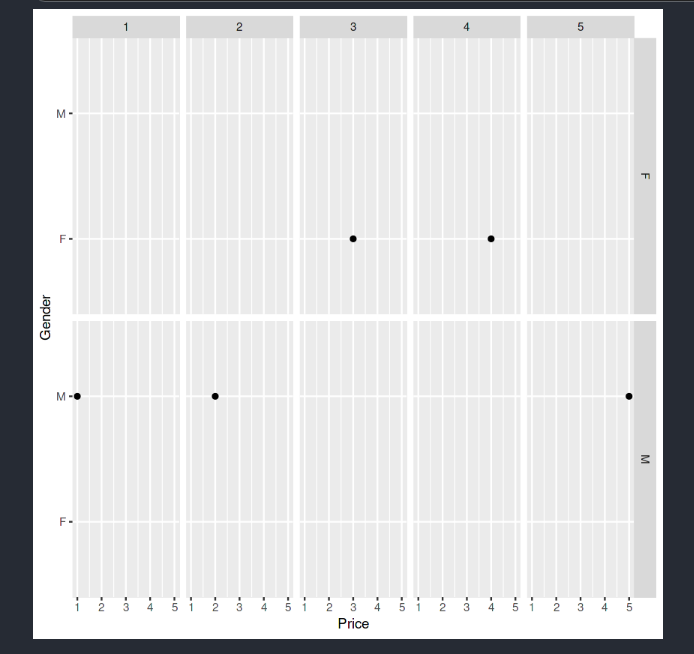
在添加注释文本之前绘图
要添加文本,请创建要应用于绘图的自定义注释文本。
例子:
ann_dat_text<-data.frame(
Gender=c(“F”,”M”),
Price=c(3,4),
label=c(“Plot 1″,”Plot 2”)
)
在这里,在上面的语句中,我们正在创建一个数据框,我们将使用它来将文本注释到构面上。在这里,我们将标签“Plot 1”和“Plot 2”应用于两个方面,在 Gender 列的“F”侧,我们将注释文本为“Plot 1”,在“M”侧,我们将有一个带注释的文本“Plot 2”。价格将指定文本的位置。
现在,通过在 geom_text()函数传递带有所需值的适当参数,将此自定义文本应用于构面。
句法:
geom_text( data, label)
使用 facet_grid,我们创建了两个 facet,在 geom_text() 中,数据将是新创建的自定义注释数据,我们将使用它来将注释文本应用到 facet。
示例:在注释单个方面后绘图。
电阻
# Annotating text on individual facet in ggplot2

# installing ggplot2 library
install.packages("ggplot2")

# loading the library
library("ggplot2")

# creating a dummy dataset
people <- c("A","B","C","D","E")
gender <- c("M","M","F","F","M")
price <- c(1,2,3,4,5)

df <- data.frame(Name = people, Gender = gender, Price = price)

# plotting the data using ggplot
plt <- ggplot(

    # providing dataset
    df,

    # to plot price vs Gender
    aes(x=Price, y=Gender)

    # to plot data point as a (.) dot
) + geom_point()


# creating a dataframe for annotating text
ann_dat_text<-data.frame(

    # Providing F as an annotation of Plot 1
    # and M as an annotation of Plot 2
    Gender=c("F","M"),
    Price=c(3,4),
    label=c("Plot 1","Plot 2")
)

# creating facet from Gender and Price variable
plt <- plt + facet_grid(Gender ~ Price)

# annotating the graph with the custom label made
plt + geom_text(

    # the new dataframe for annotating text
    data = ann_dat_text,
    label=ann_dat_text$label
)
输出:
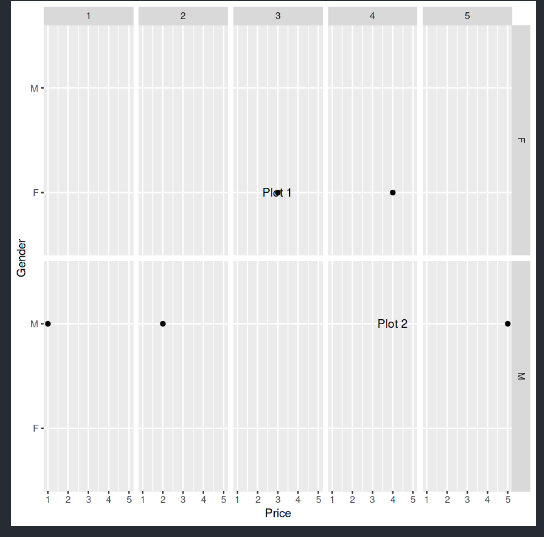
刻面的注释文本