在 R 中使用 ggplot 在同一图上绘制多个时间序列
时间序列数据是分层数据。它是一系列与时间戳相关的数据。时间序列的一个例子是某个时期或温度范围内的黄金价格或年度风暴期间的降水。为了可视化这些数据,R 提供了一个名为ggplot的方便的库。使用 ggplot,我们可以看到各种图。与 ggplot 一起,R 还提供库来清理数据并转换或操作它以满足我们的可视化要求。
本文将查看一个来自 R 数据集的数据集和一个从 CSV 文件中获取的数据集。
数据集 1:2020 年 3 月欧盟 Covid 死亡人数
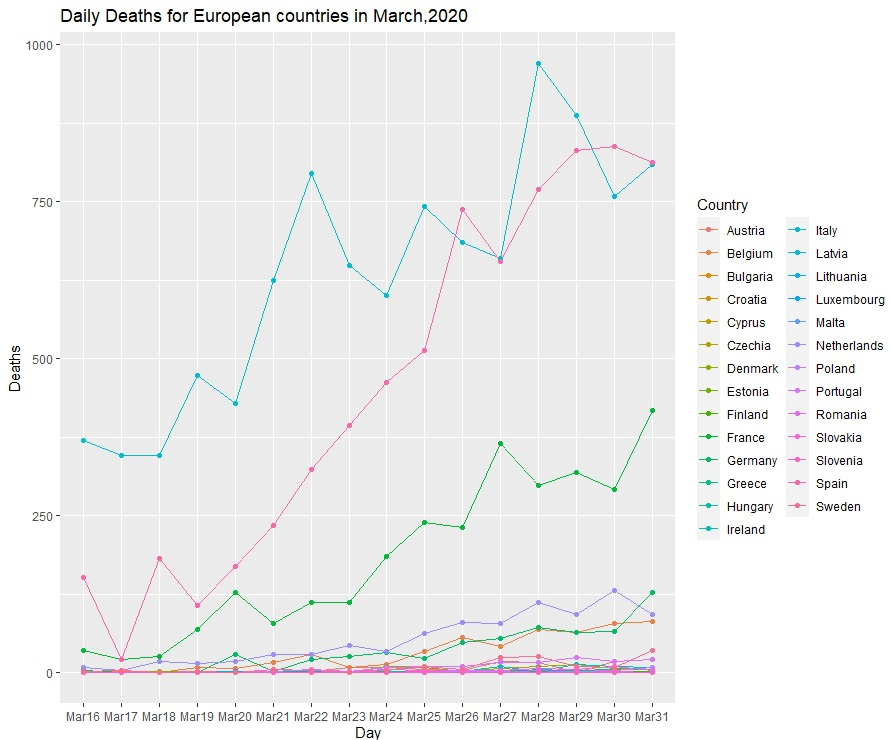
该数据集为我们提供了 2020 年 3 月所有欧洲国家的 Covid-19 每日死亡人数。我们将绘制每个国家的死亡人数(y 轴)与天数(x 轴)的关系图。
使用中的数据可以从这里下载。
图 1:每日死亡人数
绘图步骤如下:
- 打开 R Studio 并打开 R 笔记本(有更多选项)。
- 将此文件另存为 .rmd,最好与您的数据位于同一文件夹中。
- 选择数据所在的工作目录
- 导入所有 R 库
- 从 CSV 读取数据。
- 上面的数据分布在各列中。为了使绘图更容易,我们需要将数据格式化为所需的格式。
- 绘图数据
- 显示数据
例子:
R
library(ggplot2)
library(reshape2)
library(dplyr)

covid1 =(read.csv(file="EUCOVIDdeaths.csv",header=TRUE)[,-c(2)])

head(covid1)


covid_deaths <- melt(covid1,id.vars=c("Country"),value.name="value",
                     variable.name="Day")

head(covid_deaths)

covid_plot <- ggplot(data=covid_deaths, aes(x=Day, y=value, group = Country,
                                            colour = Country))
+ geom_line() +labs(y= "Deaths", x = "Day")
covid_plot + ggtitle("Daily Deaths for European countries in March,2020")+geom_point()

covid_plot
R
library(ggplot2)
library(reshape2)
library(dplyr)

covid1 =(read.csv(file="EUCOVIDdeaths.csv",header=TRUE)[,-c(2)])

head(covid1)

covid_perCapita <- covid1[,c(2:17)] / covid$PopulationM

covid_perCapita$Country <- covid1$Country

head(covid_perCapita)

covid_perCapita_deaths <- melt(covid_perCapita,id.vars=c("Country"),
                               value.name="value", variable.name="Day")

covidPerCapitaPlot <- ggplot(data=covid_perCapita_deaths,
   aes(x=Day, y=value, group = Country, colour = Country)) + geom_line()
   +labs(y= "Deaths per Capita", x = "Day")  + theme_bw(base_size = 16)
+ theme(axis.text.x=element_text(angle=60,hjust=1))
+ ggtitle("Day-wise Covid-Deaths per Capita in Europe in 2020")

covid_perCapitaPlot
R
library(hurricaneexposuredata)
library(hurricaneexposure)

rain_data <- county_rain(counties = c("01001","36005", "36047",
                                      "36061","36085", "36081",
                                      "36119","22071", "51700"),
              start_year = 1995, end_year = 2005, rain_limit = 50,
                         dist_limit = 500, days_included = c(-1, 0, 1))

ggplot(data = rain_data, aes(x=fips, y=tot_precip, group=storm_id,
                             color=storm_id)) + geom_line()
输出:

带点的每日死亡时间序列图
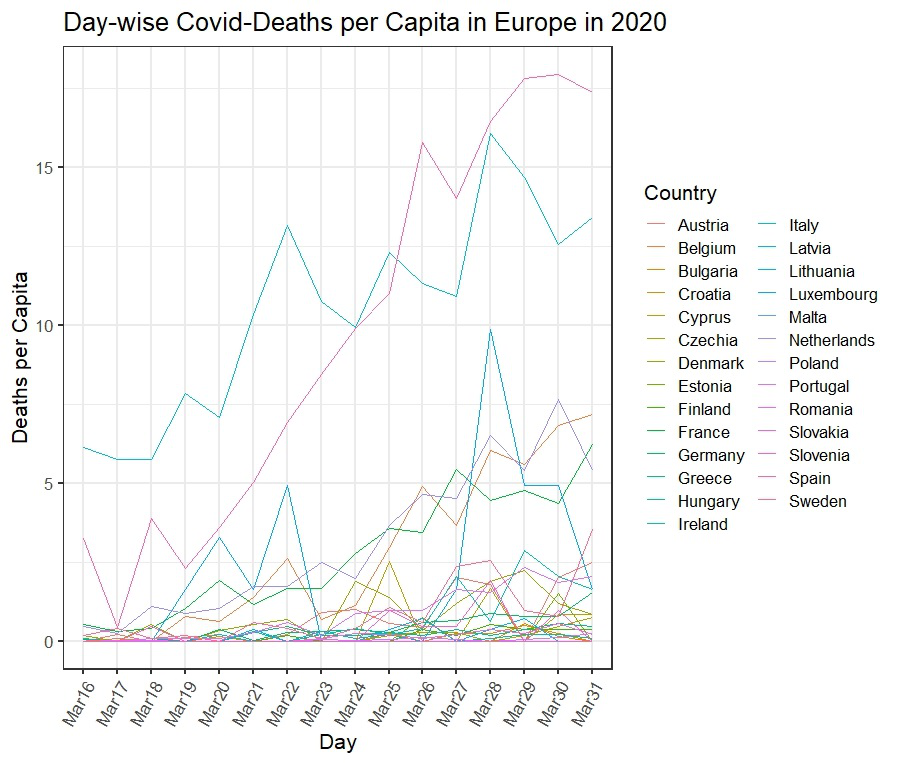
图 2:绘制人均新冠肺炎死亡人数。
我们将使用与前一个示例相同的数据。但在这里我们将处理人均数据。
电阻
library(ggplot2)
library(reshape2)
library(dplyr)

covid1 =(read.csv(file="EUCOVIDdeaths.csv",header=TRUE)[,-c(2)])

head(covid1)

covid_perCapita <- covid1[,c(2:17)] / covid$PopulationM

covid_perCapita$Country <- covid1$Country

head(covid_perCapita)

covid_perCapita_deaths <- melt(covid_perCapita,id.vars=c("Country"),
                               value.name="value", variable.name="Day")

covidPerCapitaPlot <- ggplot(data=covid_perCapita_deaths,
   aes(x=Day, y=value, group = Country, colour = Country)) + geom_line()
   +labs(y= "Deaths per Capita", x = "Day")  + theme_bw(base_size = 16)
+ theme(axis.text.x=element_text(angle=60,hjust=1))
+ ggtitle("Day-wise Covid-Deaths per Capita in Europe in 2020")

covid_perCapitaPlot
输出:

资本情节
数据集 2:热带风暴期间美国县的降雨量。
首先安装包:hurricaneexposuredata
在安装软件包之前,请检查 R 版本。要在 RStudio 中检查 R 版本,请转到工具 -> 全局选项。在打开的窗口中,在基本选项卡中,我们看到 R 版本。
#If the R version is the greater than 4
install.packages(“hurricaneexposuredata”)
#For R versions lower than 4.0, please install this way
install.packages(‘hurricaneexposuredata’, repos=’https://geanders.github.io/drat/’, type=’source’)
例子:
电阻
library(hurricaneexposuredata)
library(hurricaneexposure)

rain_data <- county_rain(counties = c("01001","36005", "36047",
                                      "36061","36085", "36081",
                                      "36119","22071", "51700"),
              start_year = 1995, end_year = 2005, rain_limit = 50,
                         dist_limit = 500, days_included = c(-1, 0, 1))

ggplot(data = rain_data, aes(x=fips, y=tot_precip, group=storm_id,
                             color=storm_id)) + geom_line()
输出:
