使用 matplotlib 添加垂直滑块
Matplotlib 不仅允许静态图,而且我们还可以准备可以交互修改的图。为此,我们可以使用小部件子模块中的滑块小部件来控制绘图的视觉属性。
水平和垂直滑块之间的唯一区别是存在一个附加参数“方向”,默认情况下设置为“水平”。
amp_slider = Slider(
ax=axamp,
label=”Amplitude”,
valmin=0,
valmax=10,
valinit=init_amplitude,
orientation=”vertical” # Update it to “horizontal” if you need a horizontal graph
)
例子:
在这里,我们将使用 Slider 小部件创建带有滚动条的函数图,可用于修改图。在此示例中,使用两个滑块(一个垂直和一个水平)来选择正弦波的幅度和频率。我们可以通过这种方式控制绘图的许多连续变化的属性。
Python
import numpy as np
import matplotlib.pyplot as plt
from matplotlib.widgets import Slider, Button

# The parameterized function to be plotted
def f(t, amplitude, frequency):
    return amplitude * np.sin(2 * np.pi * frequency * t)

t = np.linspace(0, 1, 1000)

# Defining the initial parameters
init_amplitude = 5
init_frequency = 3

# Creating the figure and the graph line that we will update
fig, ax = plt.subplots()
line, = plt.plot(t, f(t, init_amplitude, init_frequency), lw=2)
ax.set_xlabel('Time [s]')

axcolor = 'lightgoldenrodyellow'
ax.margins(x=0)

# adjusting the main plot to make space for our sliders
plt.subplots_adjust(left=0.25, bottom=0.25)

# Making a horizontally oriented slider to
# control the frequency.
axfreq = plt.axes([0.25, 0.1, 0.65, 0.03], facecolor=axcolor)
freq_slider = Slider(
    ax=axfreq,
    label='Frequency [Hz]',
    valmin=0.1,
    valmax=30,
    valinit=init_frequency,
    # orientation="horizontal" is Default
)

# Making a vertically oriented slider to control the amplitude
axamp = plt.axes([0.1, 0.25, 0.0225, 0.63], facecolor=axcolor)
amp_slider = Slider(
    ax=axamp,
    label="Amplitude",
    valmin=0,
    valmax=10,
    valinit=init_amplitude,
    orientation="vertical"
)

# Function to be rendered anytime a slider's value changes
def update(val):
    line.set_ydata(f(t, amp_slider.val, freq_slider.val))
    fig.canvas.draw_idle()

# Registering the update function with each slider Update
freq_slider.on_changed(update)
amp_slider.on_changed(update)

# Create a `matplotlib.widgets.Button` to reset
# the sliders to initial parameters.
resetax = plt.axes([0.8, 0.025, 0.1, 0.04])
button = Button(resetax, 'Reset', color=axcolor, hovercolor='0.975')

def reset(event):
    freq_slider.reset()
    amp_slider.reset()

button.on_clicked(reset)

plt.show()
输出 :

可以使用滑块有效控制连续变化的属性,如正弦波的振幅和频率:
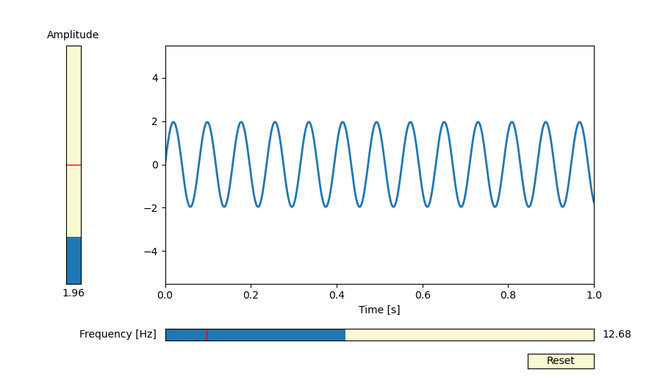
正如我们从示例图像中观察到的那样,可以在运行时使用 Matplotlib 中的 Sliders 子模块修改绘图。

因此,水平和垂直滑块之间的唯一区别是存在一个附加参数“方向”,默认情况下设置为“水平”,并且您想要的方向的实现没有区别。