Matplotlib - 更改滑块颜色
在本文中,我们将看到如何在 Matplotlib 中更改绘图的滑块颜色。首先,让我们了解一下什么是滑块小部件。 matplotlib 中的Slider小部件用于创建滚动滑块,我们可以使用滚动滑块的值在我们的Python程序中进行更改。默认情况下,滑块的颜色是蓝色,所以我们将学习更改滑块的颜色。
Syntax: Slider(dimentions, name, minimumValue, maximumValue, initialValue, color);
Parameters:
- dimentions: This parameter takes plt.axes() object to determine dimentions of slider
- name: Name of slider
- minimumValue: Minimum possible value of slider
- maximumValue: Maximum possible value of slider
- initialValue: Initial value of slider
- color: color of slider fill
安装
Windows、Linux 和 macOS 发行版具有 matplotlib 及其大部分依赖项作为轮包。运行以下命令安装 matplotlib 包:
python -mpip install -U matplotlib注意: Slider 有很多参数。我们对颜色参数感兴趣。
示例 1:
使用颜色名称,我们修改滑块的颜色。有“红色”、“蓝色”、“绿色”、“黄色”、“棕色”等……颜色名称可用。
Python
# import libraries
import matplotlib.pyplot as plt
from matplotlib.widgets import Slider

# define dimensions
width = 0.8
height = 0.25
minValue = 1
maxValue = 20

# Create dimentions of slider
dimentions_of_slider = plt.axes([0, 0, width, height])

# Create slider
mySlider = Slider(dimentions_of_slider, 'My Slider',
                  minValue, maxValue, valinit=10,
                  color='green')

# Show Graph
plt.show()
Python
# import libraries
import matplotlib.pyplot as plt
from matplotlib.widgets import Slider

# define dimensions
width = 0.8
height = 0.25
minValue = 1
maxValue = 20

# Create dimentions of slider
dimentions_of_slider = plt.axes([0, 0, width, height])

# Create slider
# Notice the HEX color code below
mySlider = Slider(dimentions_of_slider, 'My Slider',
                  minValue, maxValue, valinit=10,
                  color='#000000')

# Show Graph
plt.show()
Python
# import libraries
import matplotlib.pyplot as plt
from matplotlib.widgets import Slider

# define dimensions
width = 0.8
height = 0.25
minValue = 1
maxValue = 20

# define sliders
dimentions_of_slider1 = plt.axes([0, 0.3, width, height])
dimentions_of_slider2 = plt.axes([0, 0, width, height])

# Using name of Color
mySlider1 = Slider(dimentions_of_slider1, 'My Slider1',
                   minValue, maxValue, valinit=10,
                   color='brown')

# Using HEX Code of Color
mySlider2 = Slider(dimentions_of_slider2, 'My Slider2',
                   minValue, maxValue, valinit=10,
                   color='#123456')

# show the plot
plt.show()
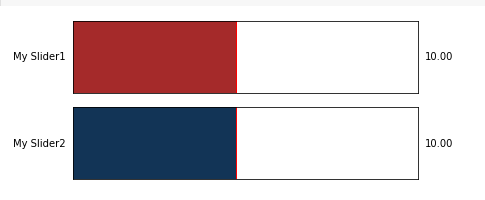
输出:

示例 2:
这个例子类似于上面的例子,但我们使用十六进制代码来定义颜色。当我们需要我们想要的确切颜色时,我们使用十六进制颜色代码。
Python
# import libraries
import matplotlib.pyplot as plt
from matplotlib.widgets import Slider

# define dimensions
width = 0.8
height = 0.25
minValue = 1
maxValue = 20

# Create dimentions of slider
dimentions_of_slider = plt.axes([0, 0, width, height])

# Create slider
# Notice the HEX color code below
mySlider = Slider(dimentions_of_slider, 'My Slider',
                  minValue, maxValue, valinit=10,
                  color='#000000')

# Show Graph
plt.show()
输出:

示例 3:
在这个例子中,我们使用不同的格式创建多个不同颜色的滑块来提及颜色。
Python
# import libraries
import matplotlib.pyplot as plt
from matplotlib.widgets import Slider

# define dimensions
width = 0.8
height = 0.25
minValue = 1
maxValue = 20

# define sliders
dimentions_of_slider1 = plt.axes([0, 0.3, width, height])
dimentions_of_slider2 = plt.axes([0, 0, width, height])

# Using name of Color
mySlider1 = Slider(dimentions_of_slider1, 'My Slider1',
                   minValue, maxValue, valinit=10,
                   color='brown')

# Using HEX Code of Color
mySlider2 = Slider(dimentions_of_slider2, 'My Slider2',
                   minValue, maxValue, valinit=10,
                   color='#123456')

# show the plot
plt.show()
输出:
