Python中的 Matplotlib.patches.Arrow 类
Matplotlib是Python中用于数组二维图的惊人可视化库。 Matplotlib 是一个基于 NumPy 数组的多平台数据可视化库,旨在与更广泛的 SciPy 堆栈一起使用。
Matplotlib.patches.Arrow
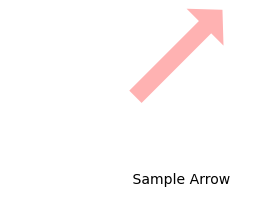
matplotlib.patches.Arrow类用于修补图中的箭头。它绘制从(x, y)到(x + dx, y + dy)的箭头,并使用 width 参数缩放其宽度。
Syntax: class matplotlib.patches.Arrow(x, y, dx, dy, width=1.0, **kwargs)
Parameters:
- x: It represents the x coordinate of the arrow tail.
- y: It represents the y coordinate of the arrow tail.
- dx: It represents arrow length in the x direction.
- dy: It represents arrow length in the y direction.
- width: It is an optional parameter and has default value as 1. it is the scale factor for the width of the arrow. In default value the tail width is 0.2 and the head width is 0.6.
- **kwargs: These are the patch properties mentioned below in the table;
| Property | Description | ||
|---|---|---|---|
| agg_filter | a filter function that takes a (m, n, 3) float array and a dpi value that returns a (m, n, 3) array | ||
| alpha | float or None | ||
| animated | bool | ||
| antialiased or aa | unknown | ||
| capstyle | {‘butt’, ’round’, ‘projecting’} | ||
| clip_box | Bbox | ||
| clip_on | bool | ||
| clip_path | [(Path, Transform)|Patch|None] | ||
| color | color or sequence of rgba tuples | ||
| contains | callable | ||
| edgecolor or ec or edgecolors | color or None or ‘auto’ | ||
| facecolor or fc or facecolors | color or None | ||
| figure | figure | ||
| fill | bool | ||
| gid | str | ||
| hatch | {‘/’, ‘\’, ‘|’, ‘-‘, ‘+’, ‘x’, ‘o’, ‘O’, ‘.’, ‘*’} | ||
| in_layout | bool | ||
| joinstyle | {‘miter’, ’round’, ‘bevel’} | ||
| linestyle or ls | {‘-‘, ‘–‘, ‘-.’, ‘:’, ”, (offset, on-off-seq), …} | ||
| linewidth or linewidths or lw | float or None | ||
| path_effects | AbstractPathEffect | ||
| picker | None or bool or float or callable | ||
| path_effects | AbstractPathEffect | ||
| picker | float or callable[[Artist, Event], Tuple[bool, dict]] | ||
| rasterized | bool or None | ||
| sketch_params | (scale: float, length: float, randomness: float) | ||
| snap | bool or None | ||
| transform | matplotlib.transforms.Transform | ||
| url | str | visible | bool |
| zorder | float |
示例 1:
import matplotlib.pyplot as plt
import numpy as np
import matplotlib.path as mpath
import matplotlib.lines as mlines
import matplotlib.patches as mpatches
from matplotlib.collections import PatchCollection


def label(xy, text):

    # shift y-value for label so that
    # it's below the artist
    y = xy[1] - 0.15
    plt.text(xy[0], y, text, ha ="center",
             family ='sans-serif', size = 14)


fig, ax = plt.subplots()

# create 3x3 grid to plot
# the artists
grid = np.mgrid[0.2:0.8:3j,
                0.2:0.8:3j].reshape(2, -1).T

patches = []


# add an arrow
arrow = mpatches.Arrow(grid[5, 0] - 0.05,
                       grid[5, 1] - 0.05, 0.1, 0.1,
                       width = 0.1)
patches.append(arrow)
label(grid[5], " Sample Arrow")


colors = np.linspace(0, 1, len(patches))
collection = PatchCollection(patches,
                             cmap = plt.cm.hsv,
                             alpha = 0.3)

collection.set_array(np.array(colors))
ax.add_collection(collection)

plt.axis('equal')
plt.axis('off')
plt.tight_layout()

plt.show()
输出: 
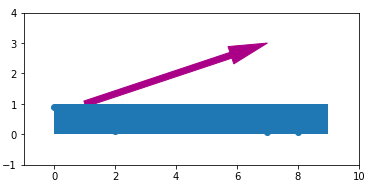
示例 2:
from matplotlib import pyplot as plt
from matplotlib.patches import Rectangle, Arrow
import numpy as np


nmax = 9
xdata = range(nmax)
ydata = np.random.random(nmax)

plt.ion()
fig, ax = plt.subplots()
ax.set_aspect("equal")
ax.plot(xdata, ydata, 'o-')
ax.set_xlim(-1, 10)
ax.set_ylim(-1, 4)


rect = Rectangle((0, 0), nmax, 1, zorder = 10)
ax.add_patch(rect)

x0, y0 = 5, 3
arrow = Arrow(1, 1, x0-1, y0-1, color ="# aa0088")

a = ax.add_patch(arrow)

plt.draw()

for i in range(nmax):

    rect.set_x(i)
    rect.set_width(nmax - i)

    a.remove()
    arrow = Arrow(1 + i, 1, x0-i + 1, y0-1,
                  color ="# aa0088")
    a = ax.add_patch(arrow)

    fig.canvas.draw_idle()
    plt.pause(0.4)

plt.waitforbuttonpress()

plt.show()
输出: 