Python|在不同颜色空间中可视化图像
OpenCV(Open Source Computer Vision)是一个计算机视觉库,包含对图片或视频执行操作的各种功能。它最初由 Intel 开发,但后来由 Willow Garage 维护,现在由 Itseez 维护。该库是跨平台的,可用于多种编程语言,如Python、C++ 等。
让我们讨论可视化图像的不同方法,我们将以不同的格式表示图像,如灰度、RGB 比例、Hot_map、边缘图、光谱图等。
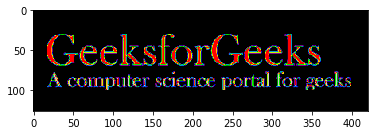
RGB 图像:
RGB 图像由 R(Red)、G(Green) 和 B(Blue) 3 个不同通道的线性组合表示。此颜色空间中的像素强度由单个通道的 0 到 255 范围内的值表示。因此,由一个像素表示的一种颜色的可能性数量约为 1600 万 [255 x 255 x 255 ]。
# Python program to read image as RGB

# Importing cv2 and matplotlib module
import cv2
import matplotlib.pyplot as plt

# reads image as RGB
img = cv2.imread('g4g.png')

# shows the image
plt.imshow(img)
输出 : 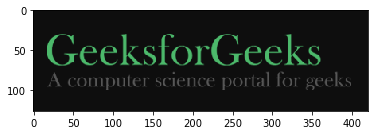
灰度图像:
灰度图像仅包含单个通道。此颜色空间中的像素强度由 0 到 255 范围内的值表示。因此,由一个像素表示的一种颜色的可能性数为 256。
# Python program to read image as GrayScale

# Importing cv2 module
import cv2

# Reads image as gray scale
img = cv2.imread('g4g.png', 0)

# We can alternatively convert
# image by using cv2color
img = cv2.cvtColor(img, cv2.COLOR_BGR2GRAY)

# Shows the image
cv2.imshow('image', img)

cv2.waitKey(0)
cv2.destroyAllWindows()
输出 : 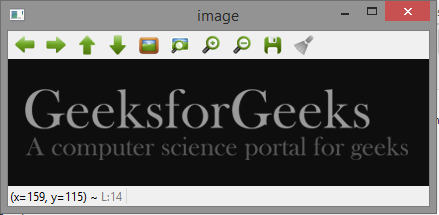
YCrCb 颜色空间:
Y 代表 Luminance 或 Luma 分量,Cb 和 Cr 是 Chroma 分量。 Cb 表示蓝色差(蓝色分量和亮度分量的差)。 Cr 表示红色差(红色分量和亮度分量的差)。
# Python program to read image
# as YCrCb color space

# Import cv2 module
import cv2

# Reads the image
img = cv2.imread('g4g.png')

# Convert to YCrCb color space
img = cv2.cvtColor(img, cv2.COLOR_BGR2YCrCb)

# Shows the image
cv2.imshow('image', img)

cv2.waitKey(0)
cv2.destroyAllWindows()
输出 : 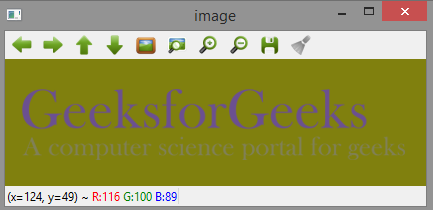
HSV色彩空间:
H:色调代表主波长。
S:饱和度代表颜色的深浅。
V:值代表强度。
# Python program to read image
# as HSV color space

# Importing cv2 module
import cv2

# Reads the image
img = cv2.imread('g4g.png')

# Converts to HSV color space
img = cv2.cvtColor(img, cv2.COLOR_BGR2HSV)

# Shows the image
cv2.imshow('image', img)

cv2.waitKey(0)
cv2.destroyAllWindows()
输出 : 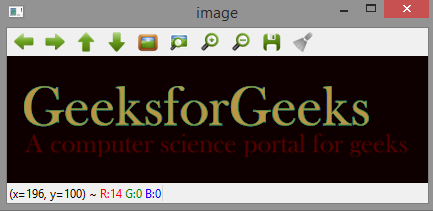
实验室色彩空间:
L——代表亮度。
A –从绿色到洋红色的颜色分量。
B –从蓝色到黄色的颜色分量。
# Python program to read image
# as LAB color space

# Importing cv2 module
import cv2

# Reads the image
img = cv2.imread('g4g.png')

# Converts to LAB color space
img = cv2.cvtColor(img, cv2.COLOR_BGR2LAB)

# Shows the image
cv2.imshow('image', img)

cv2.waitKey(0)
cv2.destroyAllWindows()
输出 : 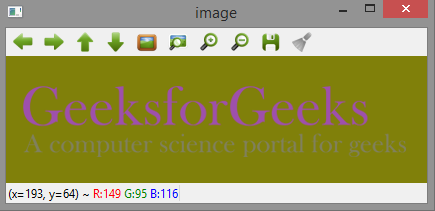
图像边缘图:
边缘图可以通过拉普拉斯算子、索贝尔等各种滤波器获得。这里,我们使用拉普拉斯算子生成边缘图。
# Python program to read image
# as EdgeMap

# Importing cv2 module
import cv2

# Reads the image
img = cv2.imread('g4g.png')


laplacian = cv2.Laplacian(img, cv2.CV_64F)
cv2.imshow('EdgeMap', laplacian)

cv2.waitKey(0)
cv2.destroyAllWindows()
输出 : 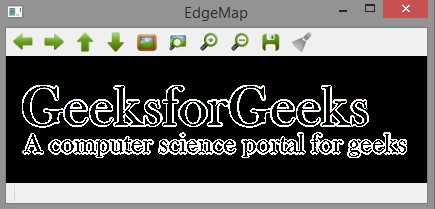
图像热图:
在热图表示中,矩阵中包含的各个值表示为颜色。
# Python program to visualize
# Heat map of image

# Importing matplotlib and cv2
import matplotlib.pyplot as plt
import cv2

# reads the image
img = cv2.imread('g4g.png')

# plot heat map image
plt.imshow(img, cmap ='hot')
输出 : 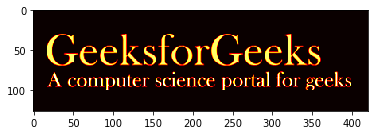
光谱图:
Spectral Image map 获取场景图像中每个像素的光谱。
# Python program to visualize
# Spectral map of image

# Importing matplotlib and cv2
import matplotlib.pyplot as plt
import cv2

img = cv2.imread('g4g.png')
plt.imshow(img, cmap ='nipy_spectral')
输出 :