📌 相关文章
- R中的数据可视化(1)
- R数据可视化(1)
- R中的数据可视化
- R数据可视化
- 使用 Matplotlib 和 Seaborn 在Python中进行数据可视化
- 使用 Matplotlib 和 Seaborn 在Python中进行数据可视化(1)
- 用于数据可视化的前 8 个Python库(1)
- 用于数据可视化的前 8 个Python库
- Python – 数据可视化教程
- Python – 数据可视化教程(1)
- Python Matplotlib数据可视化 plot折线图(1)
- Python Matplotlib数据可视化 plot折线图
- Excel 中的数据可视化(1)
- Excel 中的数据可视化
- 3D 数据可视化 Python (1)
- 在Python中使用 matplotlib 进行 COVID-19 数据可视化(1)
- 在Python中使用 matplotlib 进行 COVID-19 数据可视化
- Python的时间序列数据可视化
- Python的时间序列数据可视化(1)
- Python|使用Python可视化 O(n)
- Python|使用Python可视化 O(n)(1)
- 3D 数据可视化 Python 代码示例
- python 地理数据可视化 - Python (1)
- 使用 Matplotlib 可视化合并排序(1)
- 使用 Matplotlib 可视化合并排序
- Python – 股票数据可视化(1)
- Python – 股票数据可视化
- 使用 Matplotlib 可视化快速排序
- 使用 Matplotlib 可视化快速排序(1)
📜 Python Matplotlib数据可视化2
📅 最后修改于: 2020-09-02 07:44:00 🧑 作者: Mango
在本节中,我们将会了解到利用matplot进行数据的可视化
如果你对pandas或者numpy的操作不熟悉,可以参考相应的文章https://www.imangodoc.com/category/python
本示例的相关数据内容参考上一章节:https://www.imangodoc.com/4648.html
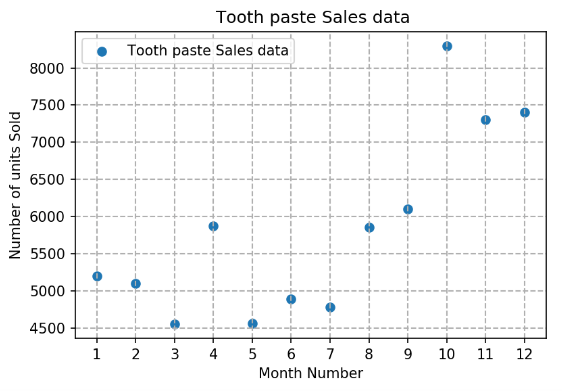
1、每个月的牙膏销售数据,绘制散点图
import pandas as pd
import matplotlib.pyplot as plt

df = pd.read_csv("./sales_data.csv")
monthList  = df ['month_number'].tolist()
toothPasteSalesData = df ['toothpaste'].tolist()
plt.scatter(monthList, toothPasteSalesData, label = 'Tooth paste Sales data')
plt.xlabel('Month Number')
plt.ylabel('Number of units Sold')
plt.legend(loc='upper left')
plt.title(' Tooth paste Sales data')
plt.xticks(monthList)
plt.grid(True, linewidth= 1, linestyle="--")
plt.show()
绘制效果如下:
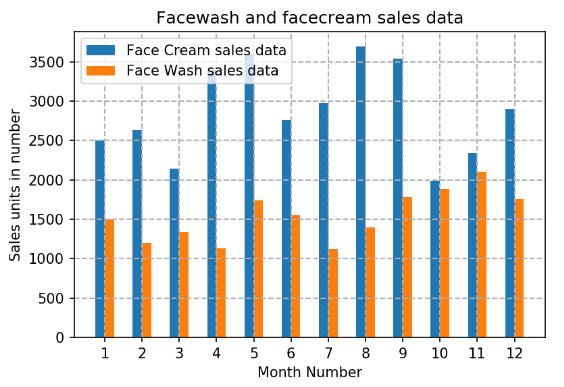
2、面霜和洗面奶,两种产品数据,绘制柱状图
import pandas as pd
import matplotlib.pyplot as plt

df = pd.read_csv("./sales_data.csv")
monthList  = df ['month_number'].tolist()
faceCremSalesData   = df ['facecream'].tolist()
faceWashSalesData   = df ['facewash'].tolist()

plt.bar([a-0.25 for a in monthList], faceCremSalesData, width= 0.25, label = 'Face Cream sales data', align='edge')
plt.bar([a+0.25 for a in monthList], faceWashSalesData, width= -0.25, label = 'Face Wash sales data', align='edge')
plt.xlabel('Month Number')
plt.ylabel('Sales units in number')
plt.legend(loc='upper left')
plt.title(' Sales data')

plt.xticks(monthList)
plt.grid(True, linewidth= 1, linestyle="--")
plt.title('Facewash and facecream sales data')
plt.show()
效果如下:
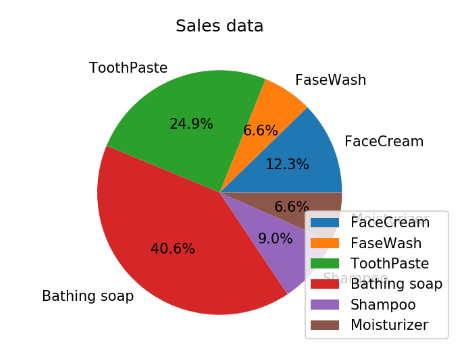
3、每种产品总销售数据,绘制饼图
饼图显示中,每种产品每年销售的单位数(以百分比为单位)
import pandas as pd
import matplotlib.pyplot as plt

df = pd.read_csv("./sales_data.csv")
monthList  = df ['month_number'].tolist()

labels = ['FaceCream', 'FaseWash', 'ToothPaste', 'Bathing soap', 'Shampoo', 'Moisturizer']
salesData   = [df ['facecream'].sum(), df ['facewash'].sum(), df ['toothpaste'].sum(),df ['bathingsoap'].sum(), df ['shampoo'].sum(), df ['moisturizer'].sum()]
plt.axis("equal")
plt.pie(salesData, labels=labels, autopct='%1.1f%%')
plt.legend(loc='lower right')
plt.title('Sales data')
plt.show()
效果如下:
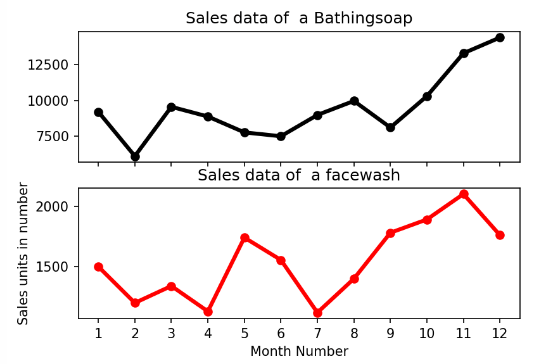
4、月份的沐浴皂洗面奶,并使用子图显示
import pandas as pd
import matplotlib.pyplot as plt

df = pd.read_csv("./sales_data.csv")
monthList  = df ['month_number'].tolist()
bathingsoap   = df ['bathingsoap'].tolist()
faceWashSalesData   = df ['facewash'].tolist()

f, axarr = plt.subplots(2, sharex=True)
axarr[0].plot(monthList, bathingsoap, label = 'Bathingsoap Sales Data', color='k', marker='o', linewidth=3)
axarr[0].set_title('Sales data of  a Bathingsoap')
axarr[1].plot(monthList, faceWashSalesData, label = 'Face Wash Sales Data', color='r', marker='o', linewidth=3)
axarr[1].set_title('Sales data of  a facewash')

plt.xticks(monthList)
plt.xlabel('Month Number')
plt.ylabel('Sales units in number')
plt.show()
显示效果如下:
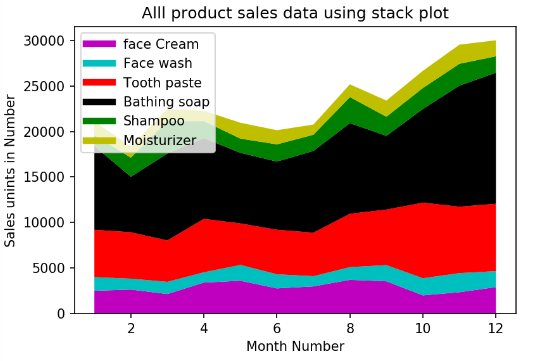
5、所有产品销售数据并使用堆栈图
import pandas as pd
import matplotlib.pyplot as plt

df = pd.read_csv("./sales_data.csv")
monthList  = df ['month_number'].tolist()

faceCremSalesData   = df ['facecream'].tolist()
faceWashSalesData   = df ['facewash'].tolist()
toothPasteSalesData = df ['toothpaste'].tolist()
bathingsoapSalesData   = df ['bathingsoap'].tolist()
shampooSalesData   = df ['shampoo'].tolist()
moisturizerSalesData = df ['moisturizer'].tolist()

plt.plot([],[],color='m', label='face Cream', linewidth=5)
plt.plot([],[],color='c', label='Face wash', linewidth=5)
plt.plot([],[],color='r', label='Tooth paste', linewidth=5)
plt.plot([],[],color='k', label='Bathing soap', linewidth=5)
plt.plot([],[],color='g', label='Shampoo', linewidth=5)
plt.plot([],[],color='y', label='Moisturizer', linewidth=5)

plt.stackplot(monthList, faceCremSalesData, faceWashSalesData, toothPasteSalesData,
              bathingsoapSalesData, shampooSalesData, moisturizerSalesData,
              colors=['m','c','r','k','g','y'])

plt.xlabel('Month Number')
plt.ylabel('Sales unints in Number')
plt.title('Alll product sales data using stack plot')
plt.legend(loc='upper left')
plt.show()
最终显示如下:
