R中的数据可视化
数据可视化是一种使用图形、图表、地图等视觉线索来提供数据洞察力的技术。这很有用,因为它有助于直观和轻松地理解大量数据,从而做出更好的决策。
R 编程语言中的数据可视化
可用的流行数据可视化工具有 Tableau、Plotly、R、Google Charts、Infogram 和 Kibana。各种数据可视化平台具有不同的能力、功能和用例。他们还需要不同的技能。本文讨论了使用 R 进行数据可视化。
R 是一门专为统计计算、图形数据分析和科学研究而设计的语言。它通常是数据可视化的首选,因为它通过其包提供了灵活性和最低要求的编码。
考虑以下用于在 R 中可视化的空气质量数据集:
| Ozone | Solar R. | Wind | Temp | Month | Day |
|---|---|---|---|---|---|
| 41 | 190 | 7.4 | 67 | 5 | 1 |
| 36 | 118 | 8.0 | 72 | 5 | 2 |
| 12 | 149 | 12.6 | 74 | 5 | 3 |
| 18 | 313 | 11.5 | 62 | 5 | 4 |
| NA | NA | 14.3 | 56 | 5 | 5 |
| 28 | NA | 14.9 | 66 | 5 | 6 |
数据可视化的类型
R 提供的一些不同类型的可视化包括:
条形图
有两种类型的条形图 - 水平和垂直,它们将数据点表示为与数据项的值成比例的特定长度的水平或垂直条。它们通常用于连续和分类变量绘图。通过将horiz参数设置为 true 和 false,我们可以分别得到水平和垂直条形图。
示例 1:
R
# Horizontal Bar Plot for
# Ozone concentration in air
barplot(airquality$Ozone,
        main = 'Ozone Concenteration in air',
        xlab = 'ozone levels', horiz = TRUE)
R
# Vertical Bar Plot for
# Ozone concentration in air
barplot(airquality$Ozone, main = 'Ozone Concenteration in air',
        xlab = 'ozone levels', col ='blue', horiz = FALSE)
R
# Histogram for Maximum Daily Temperature
data(airquality)

hist(airquality$Temp, main ="La Guardia Airport's\
Maximum Temperature(Daily)",
    xlab ="Temperature(Fahrenheit)",
    xlim = c(50, 125), col ="yellow",
    freq = TRUE)
R
# Box plot for average wind speed
data(airquality)

boxplot(airquality$Wind, main = "Average wind speed\
at La Guardia Airport",
        xlab = "Miles per hour", ylab = "Wind",
        col = "orange", border = "brown",
        horizontal = TRUE, notch = TRUE)
R
# Multiple Box plots, each representing
# an Air Quality Parameter
boxplot(airquality[, 0:4],
        main ='Box Plots for Air Quality Parameters')
R
# Scatter plot for Ozone Concentration per month
data(airquality)

plot(airquality$Ozone, airquality$Month,
     main ="Scatterplot Example",
    xlab ="Ozone Concentration in parts per billion",
    ylab =" Month of observation ", pch = 19)
R
# Set seed for reproducibility
# set.seed(110)

# Create example data
data <- matrix(rnorm(50, 0, 5), nrow = 5, ncol = 5)

# Column names
colnames(data) <- paste0("col", 1:5)
rownames(data) <- paste0("row", 1:5)

# Draw a heatmap
heatmap(data)
R
# Read dataset and convert it into
# Dataframe
data <- read.csv("worldcities.csv")
df <- data.frame(data)

# Load the required libraries
library(maps)
map(database = "world")

# marking points on map
points(x = df$lat[1:500], y = df$lng[1:500], col = "Red")
R
# Adding Titles and Labeling Axes to Plot
cone <- function(x, y){
sqrt(x ^ 2 + y ^ 2)
}

# prepare variables.
x <- y <- seq(-1, 1, length = 30)
z <- outer(x, y, cone)

# plot the 3D surface
# Adding Titles and Labeling Axes to Plot
persp(x, y, z,
main="Perspective Plot of a Cone",
zlab = "Height",
theta = 30, phi = 15,
col = "orange", shade = 0.4)
输出:

示例 2:
R
# Vertical Bar Plot for
# Ozone concentration in air
barplot(airquality$Ozone, main = 'Ozone Concenteration in air',
        xlab = 'ozone levels', col ='blue', horiz = FALSE)
输出:

条形图用于以下场景:
- 在数据集中的各种数据类别之间进行比较研究。
- 分析变量在几个月或几年内随时间的变化。
直方图
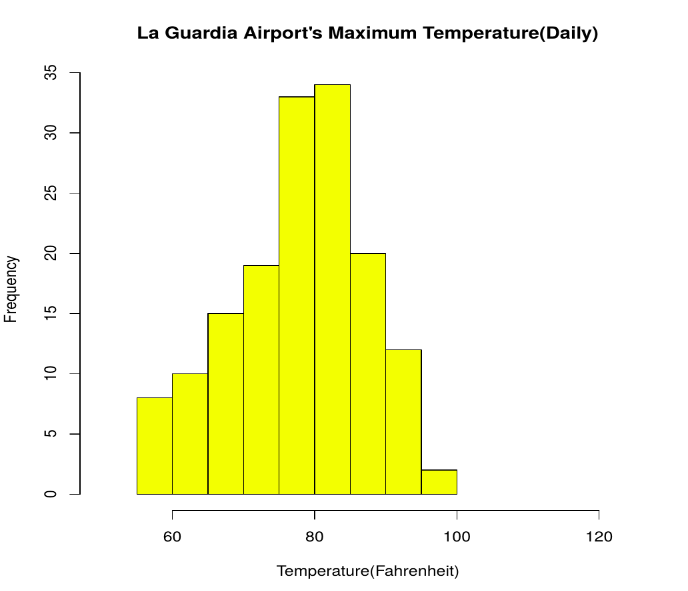
直方图就像条形图,因为它使用不同高度的条形来表示数据分布。但是,在直方图中,值被分组为称为 bin 的连续间隔。在直方图中,连续值被分组并显示在这些大小可以变化的 bin 中。
例子:
R
# Histogram for Maximum Daily Temperature
data(airquality)

hist(airquality$Temp, main ="La Guardia Airport's\
Maximum Temperature(Daily)",
    xlab ="Temperature(Fahrenheit)",
    xlim = c(50, 125), col ="yellow",
    freq = TRUE)
输出:

对于直方图,参数xlim可用于指定显示所有值的间隔。
当设置为TRUE时,另一个参数freq表示直方图中各种值的频率,当设置为FALSE时,概率密度在 y 轴上表示,因此直方图的概率密度加起来为 1。
直方图用于以下场景:
- 验证数据的均匀和对称分布。
- 识别与预期值的偏差。
箱形图
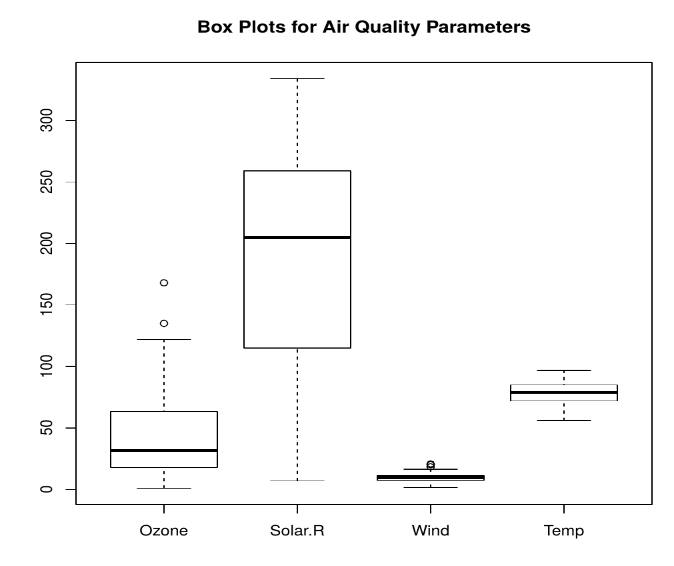
给定数据的统计摘要使用箱线图以图形方式呈现。箱线图描绘了最小和最大数据点、中值、第一和第三四分位数以及四分位数间距等信息。
例子:
R
# Box plot for average wind speed
data(airquality)

boxplot(airquality$Wind, main = "Average wind speed\
at La Guardia Airport",
        xlab = "Miles per hour", ylab = "Wind",
        col = "orange", border = "brown",
        horizontal = TRUE, notch = TRUE)
输出:

也可以通过以下代码一次生成多个箱线图:
例子:
R
# Multiple Box plots, each representing
# an Air Quality Parameter
boxplot(airquality[, 0:4],
        main ='Box Plots for Air Quality Parameters')
输出:

箱线图用于:
- 通过视觉提示对数据进行全面的统计描述。
- 识别不在数据四分位数范围内的异常点。
散点图
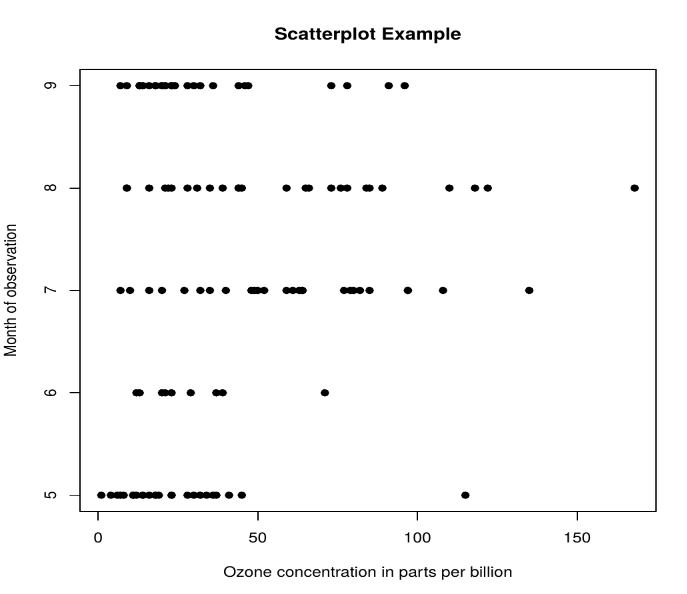
散点图由笛卡尔平面上的许多点组成。每个点表示两个参数所取的值,并帮助我们轻松识别它们之间的关系。
例子:
R
# Scatter plot for Ozone Concentration per month
data(airquality)

plot(airquality$Ozone, airquality$Month,
     main ="Scatterplot Example",
    xlab ="Ozone Concentration in parts per billion",
    ylab =" Month of observation ", pch = 19)
输出:

散点图用于以下场景:
- 显示双变量数据之间是否存在关联。
- 衡量这种关系的强度和方向。
热图
热图被定义为使用颜色来可视化矩阵值的数据的图形表示。 heatmap()函数用于绘制热图。
Syntax: heatmap(data)
Parameters: data: It represent matrix data, such as values of rows and columns
Return: This function draws a heatmap.
R
# Set seed for reproducibility
# set.seed(110)

# Create example data
data <- matrix(rnorm(50, 0, 5), nrow = 5, ncol = 5)

# Column names
colnames(data) <- paste0("col", 1:5)
rownames(data) <- paste0("row", 1:5)

# Draw a heatmap
heatmap(data)
输出:
R中的地图可视化
在这里,我们使用 maps 包使用 R 编程语言可视化和显示地理地图。
install.packages("maps")数据集链接:worldcities.csv
R
# Read dataset and convert it into
# Dataframe
data <- read.csv("worldcities.csv")
df <- data.frame(data)

# Load the required libraries
library(maps)
map(database = "world")

# marking points on map
points(x = df$lat[1:500], y = df$lng[1:500], col = "Red")
输出:

R中的3D图形
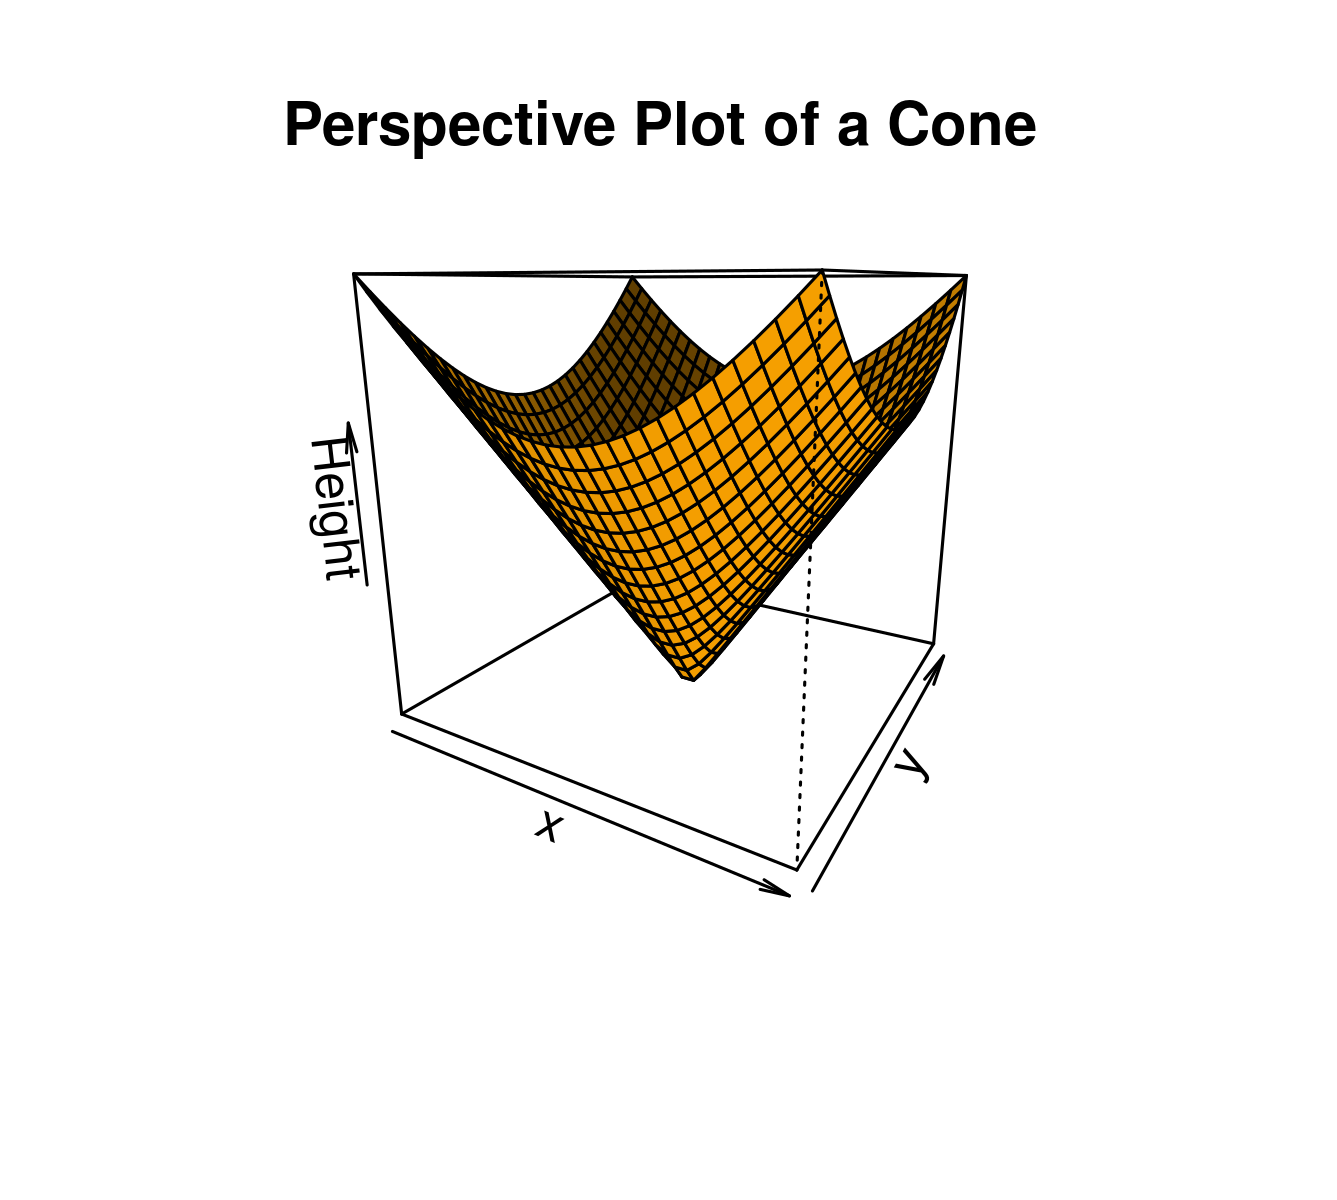
这里我们将使用 preps()函数,该函数用于在透视图中创建 3D 曲面。此函数将在 x-y 平面上绘制表面的透视图。
Syntax: persp(x, y, z)
Parameter: This function accepts different parameters i.e. x, y and z where x and y are vectors defining the location along x- and y-axis. z-axis will be the height of the surface in the matrix z.
Return Value: persp() returns the viewing transformation matrix for projecting 3D coordinates (x, y, z) into the 2D plane using homogeneous 4D coordinates (x, y, z, t).
R
# Adding Titles and Labeling Axes to Plot
cone <- function(x, y){
sqrt(x ^ 2 + y ^ 2)
}

# prepare variables.
x <- y <- seq(-1, 1, length = 30)
z <- outer(x, y, cone)

# plot the 3D surface
# Adding Titles and Labeling Axes to Plot
persp(x, y, z,
main="Perspective Plot of a Cone",
zlab = "Height",
theta = 30, phi = 15,
col = "orange", shade = 0.4)
输出:

R中数据可视化的优点:
与其他数据可视化工具相比,R 具有以下优势:
- R 提供了广泛的可视化库集合以及有关其使用的广泛在线指南。
- R 还以 3D 模型和多面板图表的形式提供数据可视化。
- 通过 R,我们可以通过更改轴、字体、图例、注释和标签轻松自定义数据可视化。
R中数据可视化的缺点:
R也有以下缺点:
- R 仅适用于在单个独立服务器上完成的数据可视化。
- 与其他对应物相比,使用 R 的数据可视化对于大量数据来说速度很慢。
应用领域:
- 向贵公司的非分析部门提供数据的分析结论。
- 健康监测设备使用数据可视化来跟踪血压、胆固醇和其他方面的任何异常情况。
- 发现消费者和营销数据中的重复模式和趋势。
- 气象学家使用数据可视化来评估全球普遍的天气变化。
- 实时地图和地理定位系统使用可视化来监控交通和估计旅行时间。