在Python中可视化图形
先决条件:图数据结构和算法
图是由节点和边组成的非线性数据结构。节点有时也称为顶点,边是连接图中任意两个节点的线或弧。
在本教程中,我们将借助networkx库在Python中可视化无向图。
安装:
要安装此模块,请在终端中键入以下命令。
pip install networkx下面是实现。
# First networkx library is imported
# along with matplotlib
import networkx as nx
import matplotlib.pyplot as plt
# Defining a Class
class GraphVisualization:
def __init__(self):
# visual is a list which stores all
# the set of edges that constitutes a
# graph
self.visual = []
# addEdge function inputs the vertices of an
# edge and appends it to the visual list
def addEdge(self, a, b):
temp = [a, b]
self.visual.append(temp)
# In visualize function G is an object of
# class Graph given by networkx G.add_edges_from(visual)
# creates a graph with a given list
# nx.draw_networkx(G) - plots the graph
# plt.show() - displays the graph
def visualize(self):
G = nx.Graph()
G.add_edges_from(self.visual)
nx.draw_networkx(G)
plt.show()
# Driver code
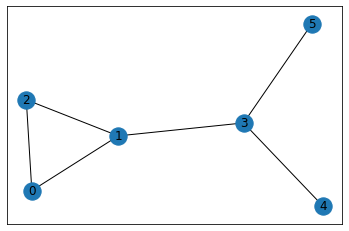
G = GraphVisualization()
G.addEdge(0, 2)
G.addEdge(1, 2)
G.addEdge(1, 3)
G.addEdge(5, 3)
G.addEdge(3, 4)
G.addEdge(1, 0)
G.visualize()
输出: