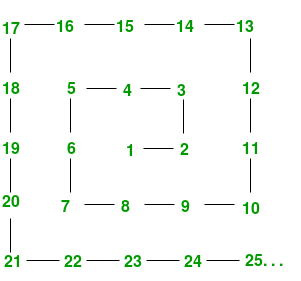
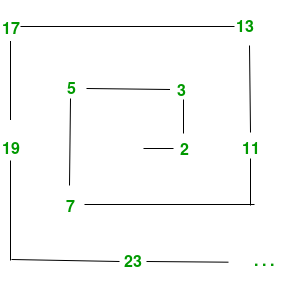
Ulam螺旋或素数螺旋是素数集的图形描述。它强调包含大量质数的突出对角线,水平线和垂直线的螺旋线中的醒目的外观。
如何构造Ulam Spiral?
如图所示,通过将正整数以螺旋排列形式写在方格上来构造数字螺旋。

通过特殊标记质数(例如,通过圈出质数或仅写质数或通过用不同的颜色书写质数和非质数)来生成Ulam螺旋,以获得类似于下图的图形。

Code to Generate Prime Number
#importing the required libraries
import math
import itertools

def primes():
    yield 2
    primesSoFar = [2]
    for candidate in itertools.count(3, 2):
        for prime in (i for i in primesSoFar if i  100:
            break
        print(p)

if __name__ == "__main__":
    main()
但这不是我们想要的。我们想产生乌兰漩涡,不是吗?
它才刚刚开始,所以下一步是产生主要的螺旋;为每个自然数(黑色或白色)生成一个像素,具体取决于该数字是否为质数。为了生成这样的图,我们将使用Python和numpy的matplotlib库进行数学计算。
所以现在的问题是,我们应该如何处理?这是一个很简单的想法。首先,我们必须生成大小为’n ^ 2’的素数数组。然后创建一个布尔值数组:1表示素数,0表示相同大小’n ^ 2’的组合。下一步应该是转换第二个布尔值数组,以使这些值从中心顺时针旋转出,为此,我们可以继续执行以下步骤:
1:生成一个元素包含“ n * n”的数组,然后将其整形为阶数为“ n X n”的矩阵形式。
2:创建另一个空列表,然后追加在步骤1中生成的矩阵的第一行。
3:删除第一行(我们刚刚附加到螺旋的那一行)。
4:逆时针旋转阵列的其余部分。
5:制作一个平坦的索引阵列,螺旋形地进入该阵列。
6:使用螺旋索引将索引索引到目标数组的扁平版本中。
在执行完这些步骤之后,您就可以很好地进行工作了,最后只需如上所述使用matplotlib绘制以下操作后获得的数组即可。下面给出了代码,我仍然强烈建议您先自己尝试一下,然后再深入研究代码。
# Python code to print Ulam's spiral
import numpy as np
import matplotlib.pyplot as plt
import matplotlib.cm as cm

# function to plot out the ulam spiral
def make_spiral(arr):
    nrows, ncols= arr.shape
    idx = np.arange(nrows*ncols).reshape(nrows,ncols)[::-1]
    spiral_idx = []
    while idx.size:
        spiral_idx.append(idx[0])

        # Remove the first row (the one we've
        # just appended to spiral).
        idx = idx[1:]

        # Rotate the rest of the array anticlockwise
        idx = idx.T[::-1]

    # Make a flat array of indices spiralling
    # into the array.
    spiral_idx = np.hstack(spiral_idx)

    # Index into a flattened version of our
    # target array with spiral indices.
    spiral = np.empty_like(arr)
    spiral.flat[spiral_idx] = arr.flat[::-1]
    return spiral

# edge size of the square array.
w = 251
# Prime numbers up to and including w**2.
primes = np.array([n for n in range(2,w**2+1) if all(
                        (n % m) != 0 for m in range(2,int(np.sqrt(n))+1))])

# Create an array of boolean values: 1 for prime, 0 for composite
arr = np.zeros(w**2, dtype='u1')
arr[primes-1] = 1

# Spiral the values clockwise out from the centre
arr = make_spiral(arr.reshape((w,w)))

plt.matshow(arr, cmap=cm.binary)
plt.axis('off')
plt.show()
为了更好地理解这个数学概念,请参考此视频。