使用 Matplotlib 在Python中绘制 3D 轮廓图
Matplotlib的引入牢记,只有二维绘图。但是在 1.0 版本发布的时候,3d 实用程序是在 2d 上开发的,因此,我们今天可以使用 3d 数据实现!通过导入mplot3d工具包启用 3d 绘图。让我们看一个 3d 余弦函数的 3d 等高线图。附上代码供参考。
| Function Arguments | Description |
|---|---|
| meshgrid | Function of numpy used to create a rectangular grid out of two given one-dimensional arrays representing the Cartesian indexing or Matrix indexing |
| plt.axes() | To create object of the axis |
| ax.contour3D | To form the contour |
| ax.set_xlabel | To label the X-axis |
| ax.set_title | To give a title to the plot |
示例 1:
from mpl_toolkits import mplot3d
import numpy as np
import matplotlib.pyplot as plt
from matplotlib import cm
import math

x = [i for i in range(0, 200, 100)]
y = [i for i in range(0, 200, 100)]

X, Y = np.meshgrid(x, y)
Z = []
for i in x:
    t = []
    for j in y:
        t.append(math.cos(math.sqrt(i*2+j*2)))
    Z.append(t)

fig = plt.figure()
ax = plt.axes(projection='3d')
ax.contour3D(X, Y, Z, 50, cmap=cm.cool)
ax.set_xlabel('a')
ax.set_ylabel('b')
ax.set_zlabel('c')
ax.set_title('3D contour for cosine')
plt.show()
输出: 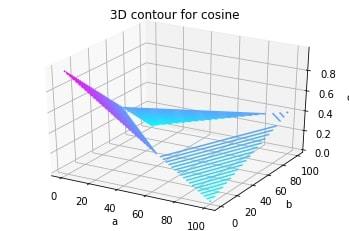
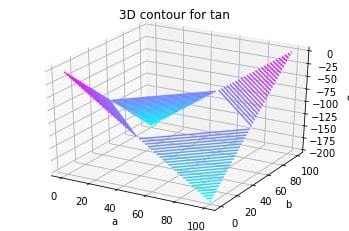
示例 2:让我们看另一个 3d 图,以便更好地理解这个概念。这次是 3d tan函数。
from mpl_toolkits import mplot3d
import numpy as np
import matplotlib.pyplot as plt
from matplotlib import cm
import math

x = [i for i in range(0, 200, 100)]
y = [i for i in range(0, 200, 100)]

X, Y = np.meshgrid(x, y)
Z = []
for i in x:
    t = []
    for j in y:
        t.append(math.tan(math.sqrt(i*2+j*2)))
    Z.append(t)

fig = plt.figure()
ax = plt.axes(projection='3d')
ax.contour3D(X, Y, Z, 50, cmap=cm.cool)
ax.set_xlabel('a')
ax.set_ylabel('b')
ax.set_zlabel('c')
ax.set_title('3D contour for tan')
plt.show()
输出: