使用 Matplotlib 在Python中绘制 3D 曲面
曲面图是三维数据集的表示。它描述了两个自变量 X 和 Z 以及指定的因变量 Y 之间的函数关系,而不是显示单个数据点。它是等高线图的伴生图。它类似于线框图,但线框的每个面都是一个填充的多边形。这有助于创建正在可视化的表面的拓扑。
创建 3D 曲面图
Matplotlib 的 mpl_toolkits.mplot3d 工具包中的 axes3d 提供了用于创建 3D 曲面图的必要函数。曲面图是使用 ax.plot_surface()函数创建的。
句法:
ax.plot_surface(X, Y, Z)其中 X 和 Y 是 x 和 y 点的二维数组,而 Z 是高度的二维数组。下面列出了 ax.plot_surface()函数的更多属性:Attribute Description X, Y, Z 2D arrays of data values cstride array of column stride(step size) rstride array of row stride(step size) ccount number of columns to be used, default is 50 rcount number of row to be used, default is 50 color color of the surface cmap colormap for the surface norm instance to normalize values of color map vmin minimum value of map vmax maximum value of map facecolors face color of individual surface shade shades the face color
示例:让我们使用上述函数创建一个 3D 表面
Python3
# Import libraries
from mpl_toolkits import mplot3d
import numpy as np
import matplotlib.pyplot as plt


# Creating dataset
x = np.outer(np.linspace(-3, 3, 32), np.ones(32))
y = x.copy().T # transpose
z = (np.sin(x **2) + np.cos(y **2) )

# Creating figure
fig = plt.figure(figsize =(14, 9))
ax = plt.axes(projection ='3d')

# Creating plot
ax.plot_surface(x, y, z)

# show plot
plt.show()
Python3
# Import libraries
from mpl_toolkits import mplot3d
import numpy as np
import matplotlib.pyplot as plt

# Creating dataset
x = np.outer(np.linspace(-3, 3, 32), np.ones(32))
y = x.copy().T # transpose
z = (np.sin(x **2) + np.cos(y **2) )

# Creating figure
fig = plt.figure(figsize =(14, 9))
ax = plt.axes(projection ='3d')

# Creating color map
my_cmap = plt.get_cmap('hot')

# Creating plot
surf = ax.plot_surface(x, y, z,
                       cmap = my_cmap,
                       edgecolor ='none')

fig.colorbar(surf, ax = ax,
             shrink = 0.5, aspect = 5)

ax.set_title('Surface plot')

# show plot
plt.show()
Python3
# Import libraries
from mpl_toolkits import mplot3d
import numpy as np
import matplotlib.pyplot as plt

# Creating dataset
x = np.outer(np.linspace(-3, 3, 32), np.ones(32))
y = x.copy().T # transpose
z = (np.sin(x **2) + np.cos(y **2) )

# Creating figure
fig = plt.figure(figsize =(14, 9))
ax = plt.axes(projection ='3d')

# Creating color map
my_cmap = plt.get_cmap('hot')

# Creating plot
surf = ax.plot_surface(x, y, z,
                       rstride = 8,
                       cstride = 8,
                       alpha = 0.8,
                       cmap = my_cmap)
cset = ax.contourf(x, y, z,
                   zdir ='z',
                   offset = np.min(z),
                   cmap = my_cmap)
cset = ax.contourf(x, y, z,
                   zdir ='x',
                   offset =-5,
                   cmap = my_cmap)
cset = ax.contourf(x, y, z,
                   zdir ='y',
                   offset = 5,
                   cmap = my_cmap)
fig.colorbar(surf, ax = ax,
             shrink = 0.5,
             aspect = 5)

# Adding labels
ax.set_xlabel('X-axis')
ax.set_xlim(-5, 5)
ax.set_ylabel('Y-axis')
ax.set_ylim(-5, 5)
ax.set_zlabel('Z-axis')
ax.set_zlim(np.min(z), np.max(z))
ax.set_title('3D surface having 2D contour plot projections')

# show plot
plt.show()
输出:

梯度曲面图
梯度曲面图是 3D 曲面图与 2D 等高线图的组合。在此图中,3D 表面的颜色与 2D 等高线图相似。表面高的部分与表面低的部分包含不同的颜色。
句法:
surf = ax.plot_surface(X, Y, Z, cmap=, linewidth=0, antialiased=False)
属性 cmap= 表示表面的颜色。也可以通过调用 fig.colorbar 添加颜色条。下面的代码创建一个渐变曲面图:
例子:
Python3
# Import libraries
from mpl_toolkits import mplot3d
import numpy as np
import matplotlib.pyplot as plt

# Creating dataset
x = np.outer(np.linspace(-3, 3, 32), np.ones(32))
y = x.copy().T # transpose
z = (np.sin(x **2) + np.cos(y **2) )

# Creating figure
fig = plt.figure(figsize =(14, 9))
ax = plt.axes(projection ='3d')

# Creating color map
my_cmap = plt.get_cmap('hot')

# Creating plot
surf = ax.plot_surface(x, y, z,
                       cmap = my_cmap,
                       edgecolor ='none')

fig.colorbar(surf, ax = ax,
             shrink = 0.5, aspect = 5)

ax.set_title('Surface plot')

# show plot
plt.show()
输出:

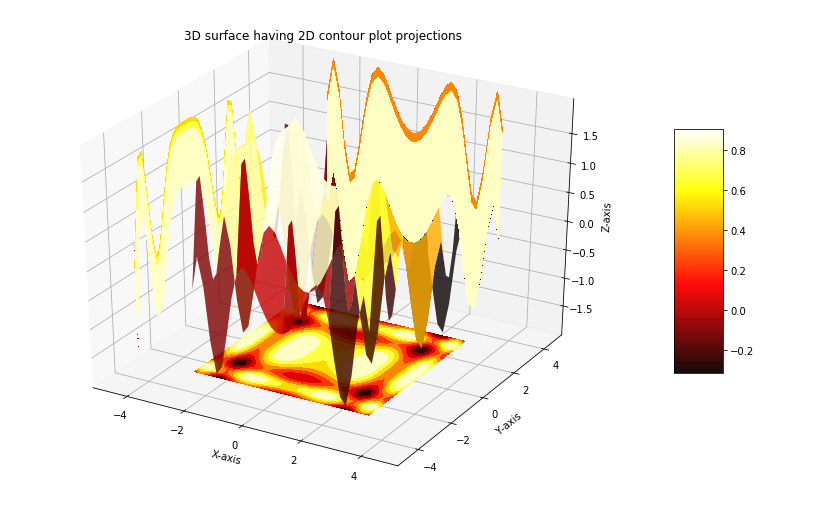
具有 2D 等高线图投影的 3D 曲面图
使用 Matplotlib 绘制的 3D 曲面图可以投影到 2D 曲面上。下面的代码创建了一个 3D 图并在 2D 等高线图上可视化了它的投影:
例子:
Python3
# Import libraries
from mpl_toolkits import mplot3d
import numpy as np
import matplotlib.pyplot as plt

# Creating dataset
x = np.outer(np.linspace(-3, 3, 32), np.ones(32))
y = x.copy().T # transpose
z = (np.sin(x **2) + np.cos(y **2) )

# Creating figure
fig = plt.figure(figsize =(14, 9))
ax = plt.axes(projection ='3d')

# Creating color map
my_cmap = plt.get_cmap('hot')

# Creating plot
surf = ax.plot_surface(x, y, z,
                       rstride = 8,
                       cstride = 8,
                       alpha = 0.8,
                       cmap = my_cmap)
cset = ax.contourf(x, y, z,
                   zdir ='z',
                   offset = np.min(z),
                   cmap = my_cmap)
cset = ax.contourf(x, y, z,
                   zdir ='x',
                   offset =-5,
                   cmap = my_cmap)
cset = ax.contourf(x, y, z,
                   zdir ='y',
                   offset = 5,
                   cmap = my_cmap)
fig.colorbar(surf, ax = ax,
             shrink = 0.5,
             aspect = 5)

# Adding labels
ax.set_xlabel('X-axis')
ax.set_xlim(-5, 5)
ax.set_ylabel('Y-axis')
ax.set_ylim(-5, 5)
ax.set_zlabel('Z-axis')
ax.set_zlim(np.min(z), np.max(z))
ax.set_title('3D surface having 2D contour plot projections')

# show plot
plt.show()
输出: