在Python中使用 Plotly 绘制三元轮廓图
Plotly 是一个Python库,用于设计图形,尤其是交互式图形。它可以绘制各种图形和图表,如直方图、条形图、箱线图、展开图等等。它主要用于数据分析以及财务分析。 plotly 是一个交互式可视化库。
Plotly 中的三元轮廓
在 plotly 中,可以使用figure_factory类的create_ternary_contour方法绘制三元轮廓图,该方法有助于表示三元图中定义的等值线,其中三个变量的总和是常数。它以图形方式将三个变量的比率描述为等边三角形中的位置。
Syntax: create_ternary_contour(coordinates, values, pole_labels=[‘a’, ‘b’, ‘c’],ncontours=None, interp_mode=’ilr’, showmarkers=False)
例子:
Python3
import plotly.figure_factory as ff
import numpy as np

test_data = np.array([[0, 0, 1, 0],
                      [0.25, 0.25, 0.5, 0],
                      [0.25, 0.25, 0.5, 0],
                      [0.25, 0.25, 0.5, 1],
                      [0.25, 0.5, 0.25, 1],
                      [0, 1, 0, 1]])

# barycentric coords: (a,b,c)
a = test_data[:, 0]
b = test_data[:, 1]
c = test_data[:, 2]

# values is stored in the last column
v = test_data[:, -1]

fig = ff.create_ternary_contour(
    np.array([a, b, c]), v,
    pole_labels=['A', 'B', 'C'],
)

fig.show()
Python3
import plotly.figure_factory as ff
import numpy as np

test_data = np.array([[0, 0, 1, 0],
                      [0.25, 0.25, 0.5, 0],
                      [0.25, 0.25, 0.5, 0],
                      [0.25, 0.25, 0.5, 1],
                      [0.25, 0.5, 0.25, 1],
                      [0, 1, 0, 1]])

# barycentric coords: (a,b,c)
a = test_data[:, 0]
b = test_data[:, 1]
c = test_data[:, 2]

# values is stored in the last column
v = test_data[:, -1]

fig = ff.create_ternary_contour(
    np.array([a, b, c]), v,
    pole_labels=['A', 'B', 'C'],
    ncontours=20,
    colorscale='Greens',
    showscale=True,
    title='Ternary Contour Plot'
)

fig.show()
Python3
import plotly.figure_factory as ff
import numpy as np

test_data = np.array([[0, 0, 1, 0],
                      [0.25, 0.25, 0.5, 0],
                      [0.25, 0.25, 0.5, 0],
                      [0.25, 0.25, 0.5, 1],
                      [0.25, 0.5, 0.25, 1],
                      [0, 1, 0, 1]])

# barycentric coords: (a,b,c)
a = test_data[:, 0]
b = test_data[:, 1]
c = test_data[:, 2]

# values is stored in the last column
v = test_data[:, -1]

fig = ff.create_ternary_contour(
    np.array([a, b, c]), v,
    pole_labels=['A', 'B', 'C'],
    ncontours=20,
    colorscale='Greens',
    showscale=True,
    title='Ternary Contour Plot',
    coloring='lines',
    showmarkers=True
)

fig.show()
输出:
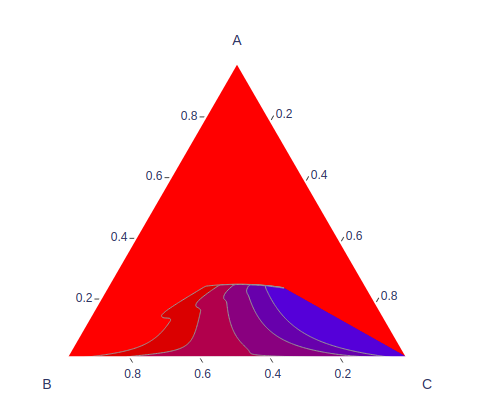
自定义三元等值线图
高度、宽度、色阶和许多其他值可以使用此函数提供的参数进行自定义。
例子:
蟒蛇3
import plotly.figure_factory as ff
import numpy as np

test_data = np.array([[0, 0, 1, 0],
                      [0.25, 0.25, 0.5, 0],
                      [0.25, 0.25, 0.5, 0],
                      [0.25, 0.25, 0.5, 1],
                      [0.25, 0.5, 0.25, 1],
                      [0, 1, 0, 1]])

# barycentric coords: (a,b,c)
a = test_data[:, 0]
b = test_data[:, 1]
c = test_data[:, 2]

# values is stored in the last column
v = test_data[:, -1]

fig = ff.create_ternary_contour(
    np.array([a, b, c]), v,
    pole_labels=['A', 'B', 'C'],
    ncontours=20,
    colorscale='Greens',
    showscale=True,
    title='Ternary Contour Plot'
)

fig.show()
输出:

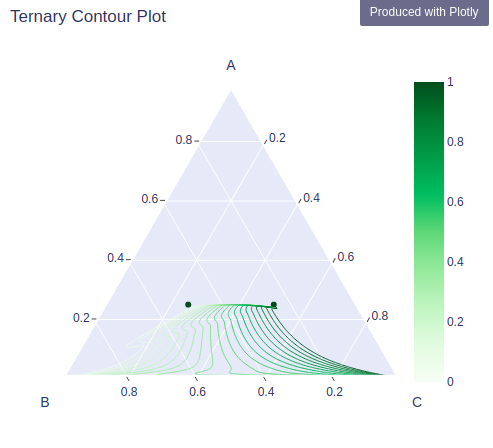
带有数据点和线的三元等值线图
参数coloring只能显示线条并将其设置为线条,并且可以通过将 True 传递给showmarkers参数来显示数据点。
例子:
蟒蛇3
import plotly.figure_factory as ff
import numpy as np

test_data = np.array([[0, 0, 1, 0],
                      [0.25, 0.25, 0.5, 0],
                      [0.25, 0.25, 0.5, 0],
                      [0.25, 0.25, 0.5, 1],
                      [0.25, 0.5, 0.25, 1],
                      [0, 1, 0, 1]])

# barycentric coords: (a,b,c)
a = test_data[:, 0]
b = test_data[:, 1]
c = test_data[:, 2]

# values is stored in the last column
v = test_data[:, -1]

fig = ff.create_ternary_contour(
    np.array([a, b, c]), v,
    pole_labels=['A', 'B', 'C'],
    ncontours=20,
    colorscale='Greens',
    showscale=True,
    title='Ternary Contour Plot',
    coloring='lines',
    showmarkers=True
)

fig.show()
输出: