Pandas GroupBy – 计算每个组合的出现次数
在本文中,我们将 GroupBy 两列并计算 Pandas 中每个组合的出现次数。
DataFrame.groupby() 方法用于将 DataFrame 分成组。它将生成数据框特定列中存在的类似数据计数的数量。
Syntax: DataFrame.groupby(by=None, axis=0, level=None )
Parameters:
- by: mapping, function, string, label, or iterable to group elements.
- axis : group by along with the row (axis=0) or column (axis=1).
- level: Integer. value to the group by a particular level or levels.
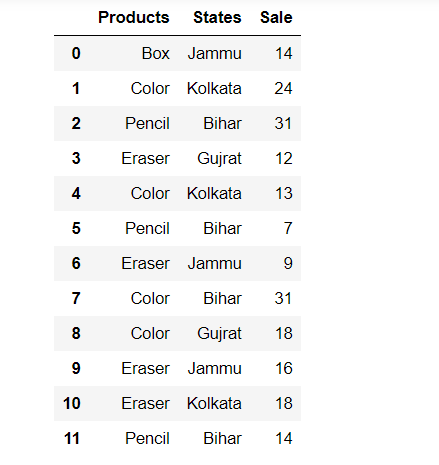
为了理解这个概念,我们将使用下面给出的简单数据集:
Python3
# Import library
import pandas as pd
import numpy as np

# initialise data of lists.
Data = {'Products':['Box','Color','Pencil','Eraser','Color',
                    'Pencil','Eraser','Color','Color','Eraser','Eraser','Pencil'],

       'States':['Jammu','Kolkata','Bihar','Gujrat','Kolkata',
                 'Bihar','Jammu','Bihar','Gujrat','Jammu','Kolkata','Bihar'],

       'Sale':[14,24,31,12,13,7,9,31,18,16,18,14]}

# Create DataFrame
df = pd.DataFrame(Data, columns=['Products','States','Sale'])

# Display the Output
display(df)
Python3
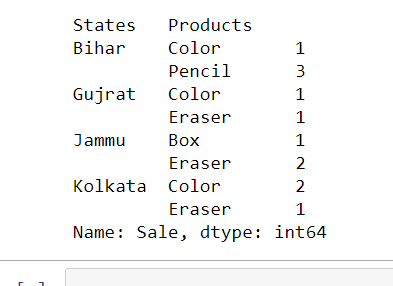
new = df.groupby(['States','Products']).size()
display(new)
Python3
new = df.groupby(['States','Products'])['Sale'].count()
display(new)
Python3
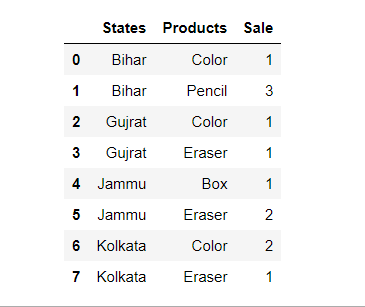
new = df.groupby(['States','Products'])['Sale'].agg('count').reset_index()
display(new)
Python3
new = df.groupby(['States','Products'],as_index = False
                ).count().pivot('States','Products').fillna(0)
display(new)
输出:

方法一:使用 Pandas dataframe.size()
它返回元素的总数,通过将 shape 方法返回的行和列相乘进行比较。
Syntax: dataframe.size
蟒蛇3
new = df.groupby(['States','Products']).size()
display(new)
输出:

方法 2:使用 Pandas dataframe.count()
它用于计算编号。给定轴上的非 NA/null 观测值。它也适用于非浮动类型的数据。
Syntax: DataFrame.count(axis=0, level=None, numeric_only=False)
Parameters:
- axis : 0 or ‘index’ for row-wise, 1 or ‘columns’ for column-wise
- level : If the axis is a MultiIndex (hierarchical), count along a particular level, collapsing into a DataFrame
- numeric_only : Include only float, int, boolean data
Returns: count : Series (or DataFrame if level specified)
蟒蛇3
new = df.groupby(['States','Products'])['Sale'].count()
display(new)
输出:

方法 3:使用 Pandas reset_index()
它是一种重置数据帧索引的方法。reset_index() 方法将范围从 0 到数据长度的整数列表设置为索引。
Syntax: DataFrame.reset_index(level=None, drop=False, inplace=False, col_level=0, col_fill=”)
Parameters:
- level: int, string or a list to select and remove passed column from index.
- drop: Boolean value, Adds the replaced index column to the data if False.
- inplace: Boolean value, make changes in the original data frame itself if True.
- col_level: Select in which column level to insert the labels.
- col_fill: Object, to determine how the other levels are named.
Return type: DataFrame
蟒蛇3
new = df.groupby(['States','Products'])['Sale'].agg('count').reset_index()
display(new)
输出:

方法 4:使用 pandas.pivot()函数
它基于 DataFrame 的 3 列生成数据透视表。使用索引/列中的唯一值并填充值。
Syntax: pandas.pivot(index, columns, values)
Parameters:
- index[ndarray] : Labels to use to make new frame’s index
- columns[ndarray] : Labels to use to make new frame’s columns
- values[ndarray] : Values to use for populating new frame’s values
Returns: Reshaped DataFrame
Exception: ValueError raised if there are any duplicates.
蟒蛇3
new = df.groupby(['States','Products'],as_index = False
                ).count().pivot('States','Products').fillna(0)
display(new)
输出:
