Matplotlib 中的平行坐标
在本文中,我们将学习如何在 Matplotlib 中绘制平行坐标。所以,首先讨论一些概念:
- Matplotlib可能是Python中用于二维数组绘图的强大可视化库。 Matplotlib 也可以是一个基于 NumPy 数组的多平台数据可视化库,旨在与更广泛的 SciPy 堆栈一起使用。它是由 John Hunter 在 2002 年引入的。
- 可视化的最大好处之一是它使我们能够以易于理解的视觉效果直观地访问大量知识。 Matplotlib 由几个图组成,如线、条、散点图、直方图等。
- 平行坐标可能是一种用于探索多维数据在分类响应上的分布并查看特征是否有任何趋势的方法。
- 使用传统的绘图类型通常可以相对直接地查看二维和三维数据。即使是四维数据,我们也会经常发现如何显示信息。
需要的步骤
- 导入库(matplotlib)
- 创建/加载数据
- 制作共享 y 轴等于 False 的子图
- 绘制所有子图
- 为 x 轴标签设置 x 轴限制
- 使宽度空间为零
- 显示最终输出的图
例子
在这里,我们将通过应用上述步骤讨论一些示例。在这些示例中,我们将处理线性和多维的虚拟数据。
例 1:(简单的平行坐标图)
Python3
# import packages
import matplotlib.pyplot as plt

# create data
x=[1,2,3,4,5]
y=[2,4,1,5,3]

# make subplots
fig,(ax1,ax2) = plt.subplots(1, 2, sharey=False)

# plot the subplots
ax1.plot(x,y)
ax2.plot(x,y)

# set x limits
ax1.set_xlim([ x[0],x[2]])
ax2.set_xlim([ x[2],x[4]])

# set width space to zero
plt.subplots_adjust(wspace=0)

# show the plots
plt.show()
Python3
# import packages
import matplotlib.pyplot as plt

# create data
x=[1,2,3,4,5,6,7,8,9]
y1=[2,4,1,5,3,4,2,5,2]
y2=[3,4,3,5,2,6,4,2,3]

# make subplots
fig, (ax1,ax2,ax3,ax4,ax5,ax6,ax7,ax8) = plt.subplots(1, 8, sharey=False)
ax = (ax1,ax2,ax3,ax4,ax5,ax6,ax7,ax8)

# plot subplots and set xlimit
for i in range(8):
    ax[i].plot(x,y1,'g-.',x,y2,'r--')
    ax[i].set_xlim([ x[i],x[i+1]])

# set width space to zero
plt.subplots_adjust(wspace=0)

# show plot
plt.show()
Python3
# import packages
import numpy as np
import matplotlib.pyplot as plt

# create data
x = np.arange(1,6)
data = [x,x*2,x*x,np.sqrt(x),-x*x,np.sin(x),np.cos(x)]
print(data)

# make subplots
fig, (ax1,ax2,ax3,ax4) = plt.subplots(1, 4, sharey=False)
ax = (ax1,ax2,ax3,ax4)

# plot subplots and set xlimit
for i in range(4):
    for j in range(len(data)):
        ax[i].plot(data[0],data[j])
    ax[i].set_xlim([x[i],x[i+1]])

# set width space to zero
plt.subplots_adjust(wspace=0)

# show plot
plt.show()
输出:

示例 2:(具有多条线和多轴的平行坐标图)
蟒蛇3
# import packages
import matplotlib.pyplot as plt

# create data
x=[1,2,3,4,5,6,7,8,9]
y1=[2,4,1,5,3,4,2,5,2]
y2=[3,4,3,5,2,6,4,2,3]

# make subplots
fig, (ax1,ax2,ax3,ax4,ax5,ax6,ax7,ax8) = plt.subplots(1, 8, sharey=False)
ax = (ax1,ax2,ax3,ax4,ax5,ax6,ax7,ax8)

# plot subplots and set xlimit
for i in range(8):
    ax[i].plot(x,y1,'g-.',x,y2,'r--')
    ax[i].set_xlim([ x[i],x[i+1]])

# set width space to zero
plt.subplots_adjust(wspace=0)

# show plot
plt.show()
输出 :

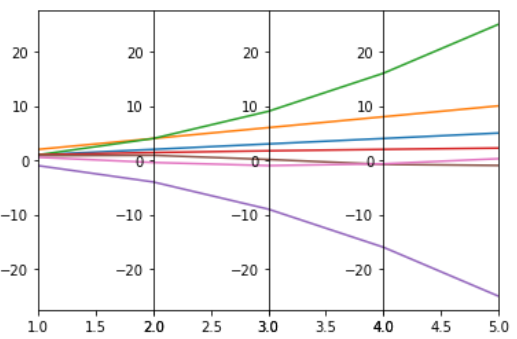
示例 3:(多维数据上的平行坐标图)
蟒蛇3
# import packages
import numpy as np
import matplotlib.pyplot as plt

# create data
x = np.arange(1,6)
data = [x,x*2,x*x,np.sqrt(x),-x*x,np.sin(x),np.cos(x)]
print(data)

# make subplots
fig, (ax1,ax2,ax3,ax4) = plt.subplots(1, 4, sharey=False)
ax = (ax1,ax2,ax3,ax4)

# plot subplots and set xlimit
for i in range(4):
    for j in range(len(data)):
        ax[i].plot(data[0],data[j])
    ax[i].set_xlim([x[i],x[i+1]])

# set width space to zero
plt.subplots_adjust(wspace=0)

# show plot
plt.show()
输出 :
