向散景图添加标签
Bokeh 包括多个用于排列绘图和小部件的布局选项。它们使排列多个组件以创建交互式仪表板或数据应用程序成为可能。布局函数可让您构建图表和小部件的网格。您可以根据需要将任意多的行、列或网格嵌套在一起。此外,散景布局支持多种“大小调整模式”。这些大小调整模式允许绘图和小部件根据浏览器窗口调整大小。
向绘图添加标签:
我们可以添加标签到 x 轴、y 轴、图例标签和绘图标题等等。标签只是一个文本,以完整的方式描述情节,并且还描述了其中的各个部分。
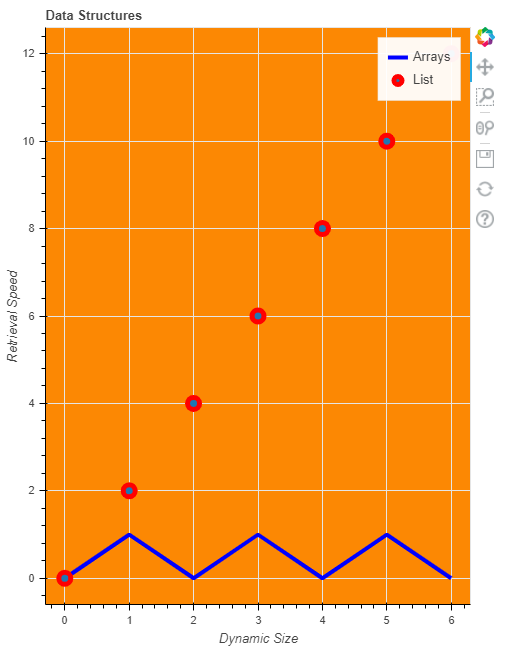
示例 1:
在这个例子中,我们将给出标题和 x 轴标签和 y 轴标签以及不同图的标签。我们将 y 轴作为检索大小,x 轴作为动态大小。我们可以在 figure() 方法中给出 x_axis_label 和 y_axis_label,并且我们还将图例标签作为 Arrays 和 List 给出。这里我们的 currentList 包含从 0 到 6 的元素,List2 是 currentList 的每个元素除以 2,List3 是 currentList 的每个元素乘以 2。一个图是 currentList,List2,一个图是 currentList,List3。
下面是一个为散景添加标签的Python程序
Python3
# python program for adding label to pokeh plot
from bokeh.io import output_file, show
from bokeh.layouts import column
from bokeh.plotting import figure

# output will be in GFG.html
output_file("GFG.html")
currentList = list(range(7))

List2 = [i % 2 for i in currentList]
List3 = [i*2 for i in currentList]

f1 = figure(title="Data Structures",
            x_axis_label="Dynamic Size",
            y_axis_label="Retrieval Speed",
            plot_width=500,
            plot_height=650,
            background_fill_color="#fc8803")

f1.line(currentList,
        List2,
        line_width=4,
        line_color='blue',
        legend_label='Arrays')
f1.circle(currentList,
          List3, size=12,
          line_width=5,
          line_color='red',
          legend_label='List')

show(f1)
Python3
# python program for giving label to plot
from bokeh.io import output_file, show
from bokeh.layouts import column
from bokeh.plotting import figure

# output will be in GFG.html
output_file("GFG.html")
currentList = list(range(7))

# creating two list from currentList
List2 = [i % 2 for i in currentList]
List3 = [i*2 for i in currentList]

# giving figure the basic attributes and labels
f1 = figure(title="Data Structures",
            plot_width=500,
            plot_height=650,
            background_fill_color="#e6df15")

f1.xaxis.axis_label = "Dynamic Size"
f1.yaxis.axis_label = "Retrieval Speed"

# giving legend labels and other attributes
f1.line(currentList,
        List2, line_width=4,
        line_color='blue',
        legend_label='LinkedList')

# giving legend labels and other attribute
f1.circle(currentList,
          List3,
          size=12,
          line_width=5,
          line_color='red',
          legend_label='ArrayList')

# showing plots
show(f1)
输出 :
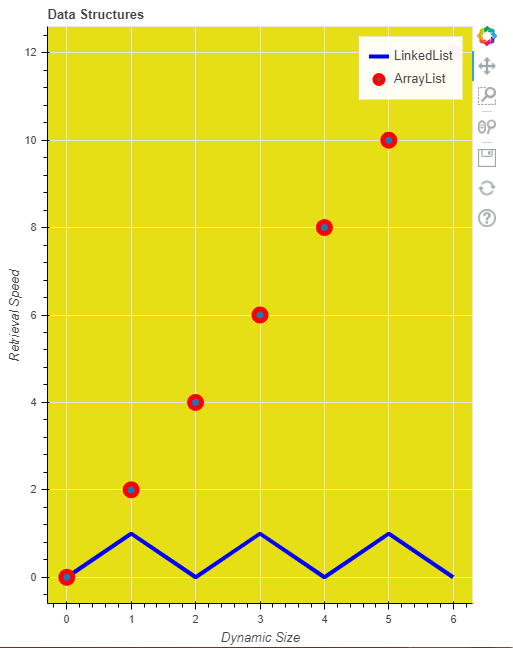
示例 2:
在这个例子中,我们将在 figure 方法之外给出 x 轴标签和 y 轴标签,或者你可以说我们将它们的值作为属性而不是方法参数。在这里,我们还将圆的图例标签指定为 ArrayList,将线命名为 Linked List 并更改背景颜色。您也可以使用自己的想法来定制它。这里我们的 currentList 包含从 0 到 6 的元素,List2 是 currentList 的每个元素除以 2,List3 是 currentList 的每个元素乘以 2。一个图是 currentList、List2,一个图是 currentList、List3。
下面是为散景图提供标签的代码。
蟒蛇3
# python program for giving label to plot
from bokeh.io import output_file, show
from bokeh.layouts import column
from bokeh.plotting import figure

# output will be in GFG.html
output_file("GFG.html")
currentList = list(range(7))

# creating two list from currentList
List2 = [i % 2 for i in currentList]
List3 = [i*2 for i in currentList]

# giving figure the basic attributes and labels
f1 = figure(title="Data Structures",
            plot_width=500,
            plot_height=650,
            background_fill_color="#e6df15")

f1.xaxis.axis_label = "Dynamic Size"
f1.yaxis.axis_label = "Retrieval Speed"

# giving legend labels and other attributes
f1.line(currentList,
        List2, line_width=4,
        line_color='blue',
        legend_label='LinkedList')

# giving legend labels and other attribute
f1.circle(currentList,
          List3,
          size=12,
          line_width=5,
          line_color='red',
          legend_label='ArrayList')

# showing plots
show(f1)
输出 :