在 R 编程中使用二维列表绘制图形
List 是 R 编程中的一种对象。列表可以包含异构元素,如字符串、数字、矩阵,甚至列表。列表是包含其他对象的通用向量。在 R 编程中可以通过在列表中创建更多列表来创建二维列表,或者简单地说,我们可以说嵌套列表。 R 编程中的list()函数用于创建列表。在本文中,我们将学习在 R 编程中使用二维列表创建绘图图。
创建二维列表
可以使用list()函数创建二维列表。
Syntax: list(x)
Parameter:
x: represents objects to be inserted in list
例子:
# Defining objects
x <- c(1, 2, 3, 4)

y <- LETTERS[1:4]

# Adding lists into a list
ls <- list(
  list(x),
  list(y)
)

# Print list
print(ls)
输出:
[[1]]
[[1]][[1]]
[1] 1 2 3 4


[[2]]
[[2]][[1]]
[1] "A" "B" "C" "D"
使用二维列表创建绘图图
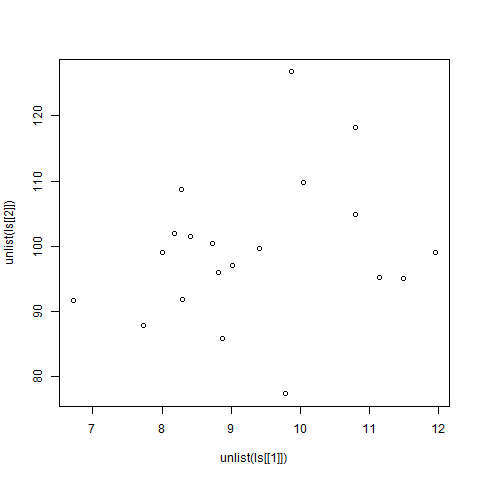
要创建绘图图,列表必须作为向量传递给plot()函数作为坐标值。 unlist()函数将列表转换为原子类型的向量。
例子:
# Creating nested lists with random values
ls <- list(
  list(rnorm(20, mean = 10, sd = 2)),
  list(rnorm(20, mean = 100, sd = 10)))

# Output to be present as PNG file
png(file = "2DListGraph.png")

# Plotting list
plot(unlist(ls[[1]]), unlist(ls[[2]]))

# Saving the file
dev.off()
输出: 