使用 ggplot2 在 R 中处理图例
的阴谋中的图例帮助我们了解哪些群体属于每个条形图,折线图,或盒基于其类型,颜色等。我们可以用传奇()函数中的R添加图例框。这些工作作为指导。键可以通过刻度中断来确定。在本文中,我们将使用 R 编程语言中的 ggplot2 处理图例和相关定制。
句法 :
legend(x, y = NULL, legend, fill = NULL, col = par(“col”), border = “black”, lty, lwd, pch)
安装
我们将首先安装和加载ggplot2包,因为没有这个包,我们将无法绘制我们的数据。因此,我们可以使用以下命令安装该软件包。
install.packages("ggplot2")使用 R 编程语言中的库函数加载包。
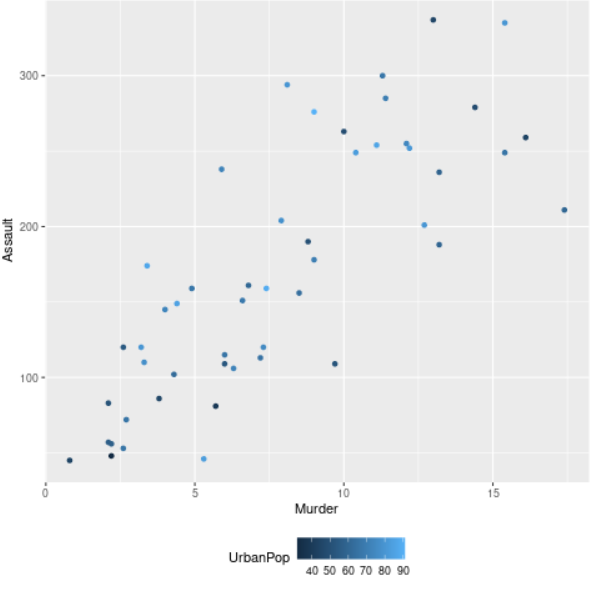
我们将尝试使用ggplot()函数绘制数据的不同方面。对于处理可以相互比较的数据的图,默认情况下将生成适当的图例以供参考。
示例:显示默认图例的 R 程序
R
library(ggplot2)

# Read the dataset
data("USArrests")

head(USArrests)

# Plot the data
plt <- ggplot(USArrests, aes(Murder, Assault, colour = UrbanPop)) +
geom_point()

plt
R
# Installing and loading the package
library(ggplot2)

# Read the dataset
data("USArrests")

# Plot the data
plt <- ggplot(USArrests, aes(Murder, Assault, colour = UrbanPop)) +
geom_point()

# Changing the title and font style of the
# text of legend
plt + theme(legend.title = element_text(colour = "red", size = 12))
R
library(ggplot2)

# Read the dataset
data("USArrests")

head(USArrests)

# Plot the data
plt <- ggplot(USArrests, aes(Murder, Assault, colour = UrbanPop)) +
geom_point()

plt + theme(legend.text = element_text(colour = "blue", size = 9))

plt
R
# Installing and loading the package
library(ggplot2)

# Read the dataset
data("USArrests")

# Plot the data
plt <- ggplot(USArrests, aes(Murder, Assault, colour = UrbanPop)) +
geom_point()

# Hiding legend title
plt + theme(legend.title = element_blank())
R
# Installing and loading the package
library(ggplot2)

# Read the dataset
data("USArrests")

# Plot the data
plt <- ggplot(USArrests, aes(Murder, Assault, colour = UrbanPop))+
geom_point()

# Removing legend
plt + theme(legend.position = "none")
R
# Installing and loading the package
library(ggplot2)

# Read the dataset
data("USArrests")

# Plot the data
plt <- ggplot(USArrests, aes(Murder, Assault, colour = UrbanPop)) +
geom_point()

# For placing the legend position as top
plt + theme(legend.position = "top")
R
# Installing and loading the package
library(ggplot2)

# Read the dataset
data("USArrests")

# Plot the data
plt <- ggplot(USArrests, aes(Murder, Assault, colour = UrbanPop)) +
geom_point()

# For placing the legend position as bottom
plt + theme(legend.position = "bottom")
R
library(ggplot2)

# Read the dataset
data("USArrests")

head(USArrests)

# Plot the data
plt <- ggplot(USArrests, aes(Murder, Assault, colour = UrbanPop)) +
geom_point()

# Drawing a rectangular box around legend
# and adding background color to it
plt + theme( legend.background = element_rect( fill = "lightblue",
                size = 0.5, linetype = "solid", colour = "black"))
R
library(ggplot2)

data("USArrests")

head(USArrests)

# Plot the data
plt <- ggplot(USArrests, aes(Murder, Assault, colour =
                    as.factor(UrbanPop))) + geom_point()+
      theme(legend.key = element_rect( color = "black",
                                      fill = "light blue"))

plt
R
library(ggplot2)

data("USArrests")

head(USArrests)

# Plot the data
plt <- ggplot(USArrests, aes(Murder, Assault, colour = as.factor(UrbanPop))) +
geom_point()+ theme(legend.key = element_rect( color = "white", fill = "black"))

plt
输出 :

这样生成的图例可以根据要求轻松定制。
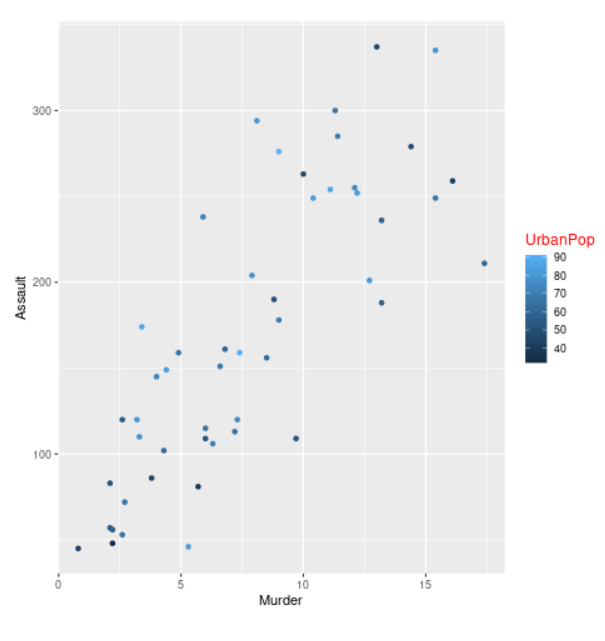
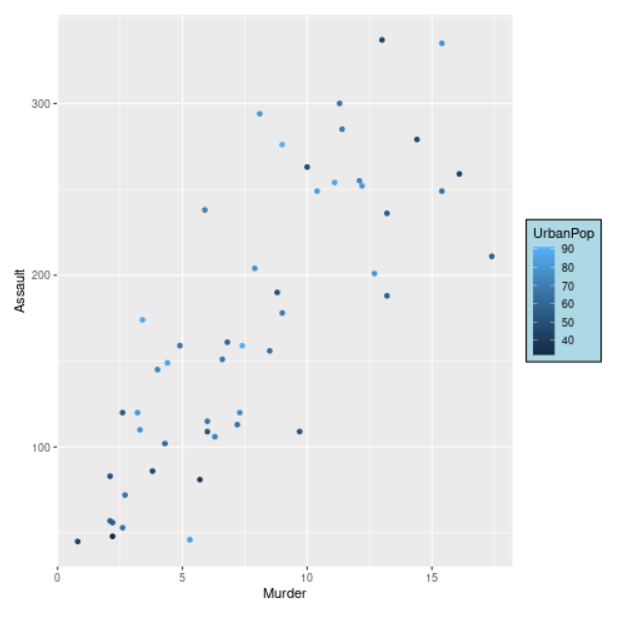
更改图例标题的颜色和大小
在这里,我们将更改从情节形成的图例标题的颜色和大小。这可以使用 theme()函数来完成。我们将在这个函数传递legend.title 参数。 Legend.title 参数基本上是指所形成的图例的标题。 Legend.title 参数等于从标题继承的 element_text函数,并接受颜色、大小等参数。
句法 :
theme( legend.title = element_text(), …., complete = FALSE, validate = TRUE)
示例:自定义图例标题的R程序
电阻
# Installing and loading the package
library(ggplot2)

# Read the dataset
data("USArrests")

# Plot the data
plt <- ggplot(USArrests, aes(Murder, Assault, colour = UrbanPop)) +
geom_point()

# Changing the title and font style of the
# text of legend
plt + theme(legend.title = element_text(colour = "red", size = 12))
输出 :
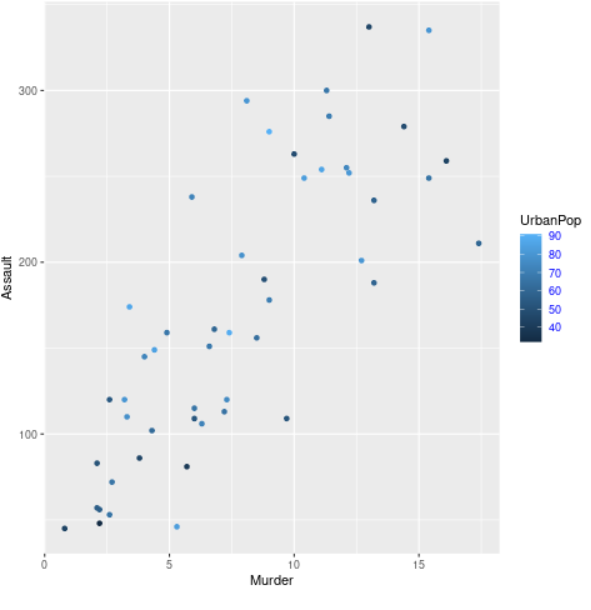
更改标签的颜色和大小
在这里,我们将更改形成的图例标签的颜色和大小。这可以通过将legend.text 作为参数使用theme()函数来完成。 Legend.text 相当于 element_text()函数,它是从 text 继承的,并接受颜色、大小、字体等参数。legend.text 参数基本上是指图例项s 的标签。
句法 :
theme( legend.text = element_text(), … , complete = FALSE, validate = TRUE)
示例:自定义图例标签的 R 程序
电阻
library(ggplot2)

# Read the dataset
data("USArrests")

head(USArrests)

# Plot the data
plt <- ggplot(USArrests, aes(Murder, Assault, colour = UrbanPop)) +
geom_point()

plt + theme(legend.text = element_text(colour = "blue", size = 9))

plt
输出 :
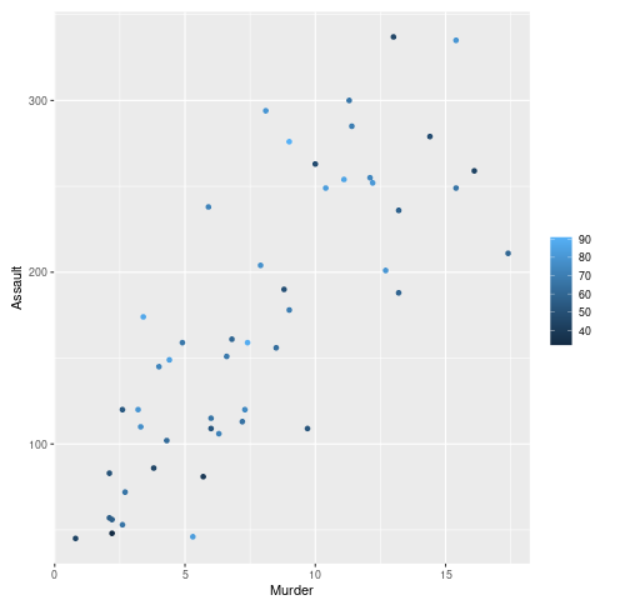
隐藏图例标题
我们将使用提供legend.title 作为参数的theme()函数在此处隐藏图例标题。在这里,legend.title 等于 element_blank()函数。 element_blank() 不分配空间,也不绘制任何内容。
句法 :
theme( legend.title = element_blank(),…., complete = FALSE, validate = TRUE)
示例:隐藏图例标题的 R 程序
电阻
# Installing and loading the package
library(ggplot2)

# Read the dataset
data("USArrests")

# Plot the data
plt <- ggplot(USArrests, aes(Murder, Assault, colour = UrbanPop)) +
geom_point()

# Hiding legend title
plt + theme(legend.title = element_blank())
输出 :
删除图例
我们可以通过在legend.position 中提供“none”作为theme()函数的参数来移除图例。 legend.position 参数指的是图例的位置。
句法 :
theme( legend.position = “none”, … , complete = FALSE, validate = TRUE)
示例:删除图例的 R 程序
电阻
# Installing and loading the package
library(ggplot2)

# Read the dataset
data("USArrests")

# Plot the data
plt <- ggplot(USArrests, aes(Murder, Assault, colour = UrbanPop))+
geom_point()

# Removing legend
plt + theme(legend.position = "none")
输出 :

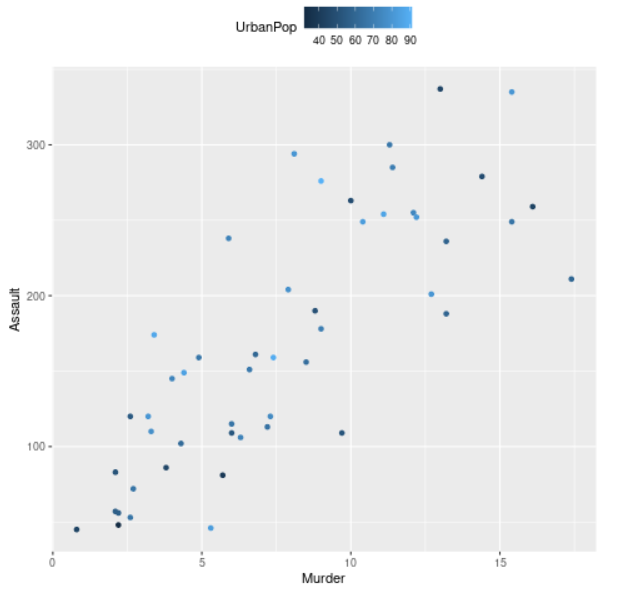
将图例位置放在顶部
在这里,我们将图例的位置从侧面更改为顶部。我们将使用theme()函数并提供legend.position 作为参数来执行此操作。 legend.position 参数将被指定为顶部。
句法 :
theme( legend.position = “top”, …, complete = FALSE, validate = TRUE)
示例:将图例放置在顶部的 R 程序
电阻
# Installing and loading the package
library(ggplot2)

# Read the dataset
data("USArrests")

# Plot the data
plt <- ggplot(USArrests, aes(Murder, Assault, colour = UrbanPop)) +
geom_point()

# For placing the legend position as top
plt + theme(legend.position = "top")
输出 :
将图例位置放在底部
在这里,我们将更改图例的位置并将其放置在底部。我们将使用theme()函数,我们将传递legend.position 参数。 legend.position 参数将被分配 底部。
句法 :
theme( legend.position = “bottom”, …, complete = FALSE, validate = TRUE)
示例: R 程序将图例放在底部
电阻
# Installing and loading the package
library(ggplot2)

# Read the dataset
data("USArrests")

# Plot the data
plt <- ggplot(USArrests, aes(Murder, Assault, colour = UrbanPop)) +
geom_point()

# For placing the legend position as bottom
plt + theme(legend.position = "bottom")
输出 :
在图例周围绘制一个框并为其添加背景颜色
我们将在我们的图例周围添加一个框并使用 theme()函数并提供 legend.background 作为参数。 Legend.background 等于 element_rect()函数,该函数在我们的图例周围创建一个矩形框,我们可以使用 fill 参数为其添加背景颜色。
句法 :
theme( legend.box.background = element_rect(), …., complete = FALSE, validate = TRUE)
示例:在图例周围绘制一个框并为其添加背景颜色的 R 程序
电阻
library(ggplot2)

# Read the dataset
data("USArrests")

head(USArrests)

# Plot the data
plt <- ggplot(USArrests, aes(Murder, Assault, colour = UrbanPop)) +
geom_point()

# Drawing a rectangular box around legend
# and adding background color to it
plt + theme( legend.background = element_rect( fill = "lightblue",
                size = 0.5, linetype = "solid", colour = "black"))
输出 :
更改键样式和更改图例颜色
我们可以使用主题函数并提供 legend.key 作为参数来更改图例的键样式和图例颜色。 legend.key 参数等于 element_rect函数,其中包含图例键的轮廓颜色的“color”和键的内部颜色的“fill”作为其参数。 as.factor()函数将用于颜色参数,以将向量或列从数字转换为因子。
示例: R 程序更改键样式和图例颜色
电阻
library(ggplot2)

data("USArrests")

head(USArrests)

# Plot the data
plt <- ggplot(USArrests, aes(Murder, Assault, colour =
                    as.factor(UrbanPop))) + geom_point()+
      theme(legend.key = element_rect( color = "black",
                                      fill = "light blue"))

plt
输出 :

示例 2: R 程序更改键样式和图例颜色
电阻
library(ggplot2)

data("USArrests")

head(USArrests)

# Plot the data
plt <- ggplot(USArrests, aes(Murder, Assault, colour = as.factor(UrbanPop))) +
geom_point()+ theme(legend.key = element_rect( color = "white", fill = "black"))

plt
输出 :
