在 R 中删除 ggplot2 中的图例
在本文中,我们将讨论如何使用 R 编程语言从图中删除图例。
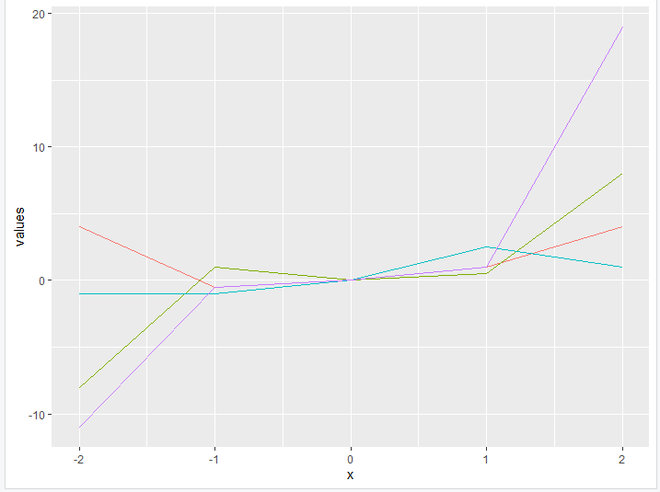
让我们先看一下初始图,这样差异就很明显了:
R
library("ggplot2")

function1<- function(x){x**2}
function2<-function(x){x**3}
function3<-function(x){x/2}
function4<-function(x){2*(x**3)+(x**2)-(x/2)}

df=data.frame(x=-2:2,
              values=c(function1(-2:2),
                       function2(-2:2),
                       function3(-2:2),
                       function4(-2:2)),
              fun=rep(c("function1","function2",
                        "function3","function4"))
)

ggplot(df,aes(x,values,col=fun))+geom_line()
R
library("ggplot2")

function1<- function(x){x**2}
function2<-function(x){x**3}
function3<-function(x){x/2}
function4<-function(x){2*(x**3)+(x**2)-(x/2)}

df=data.frame(x=-2:2,
              values=c(function1(-2:2),
                       function2(-2:2),
                       function3(-2:2),
                       function4(-2:2)),
              fun=rep(c("function1","function2",
                        "function3","function4"))
)

ggplot(df,aes(x,values,col=fun))+geom_line()+
theme(legend.position="none")
R
library("ggplot2")

function1<- function(x){x**2}
function2<-function(x){x**3}
function3<-function(x){x/2}
function4<-function(x){2*(x**3)+(x**2)-(x/2)}

df=data.frame(x=-2:2,
              values=c(function1(-2:2),
                       function2(-2:2),
                       function3(-2:2),
                       function4(-2:2)),
              fun=rep(c("function1","function2",
                        "function3","function4"))
)

ggplot(df,aes(x,values,col=fun))+geom_line()
+guides(col="none")
输出:

方法一:使用theme()
theme()函数是自定义绘图的非数据组件的强大方法:即标题、标签、字体、背景、网格线和图例。此函数还可用于为绘图提供一致的自定义外观。
Syntax: theme (legend.position)
Parameter:
- legend.position: changes the legend position to some specified value.
在legend.position 设置为none 的情况下调用主题函数将完成工作。
示例:删除图例
电阻
library("ggplot2")

function1<- function(x){x**2}
function2<-function(x){x**3}
function3<-function(x){x/2}
function4<-function(x){2*(x**3)+(x**2)-(x/2)}

df=data.frame(x=-2:2,
              values=c(function1(-2:2),
                       function2(-2:2),
                       function3(-2:2),
                       function4(-2:2)),
              fun=rep(c("function1","function2",
                        "function3","function4"))
)

ggplot(df,aes(x,values,col=fun))+geom_line()+
theme(legend.position="none")
输出:
方法二:使用guides()
另一种选择是使用适当的术语调用 guides() 方法,该术语已用于设置生成的绘图对象的色差。无论是填充还是颜色,都应设置为无。
Syntax: guides(color/fill=”none”)
示例:删除图例
电阻
library("ggplot2")

function1<- function(x){x**2}
function2<-function(x){x**3}
function3<-function(x){x/2}
function4<-function(x){2*(x**3)+(x**2)-(x/2)}

df=data.frame(x=-2:2,
              values=c(function1(-2:2),
                       function2(-2:2),
                       function3(-2:2),
                       function4(-2:2)),
              fun=rep(c("function1","function2",
                        "function3","function4"))
)

ggplot(df,aes(x,values,col=fun))+geom_line()
+guides(col="none")
输出:

