Power BI – 地图、散点图和交互式 BI 报告
先决条件: Power BI – 时间序列、聚合和过滤器
本文讨论了一些用于创建交互式仪表板以便做出大型商业智能决策的重要概念。我们将讨论以下主题:
- 地图
- 散点图
- 交互式 BI 报告
使用的数据集:
Excel 文件“ AmazingMartGeo ”包含 2 个数据集-
- 订单列表
- 订单明细。
在 Power BI 中上传数据集时,它会自动加入。 (您可以阅读不同类型的 JOINS IN SQL 以了解可以将数据集连接在一起的不同方式)。您可以从这里下载数据集:DATASET。数据集的连接如图 1 所示。
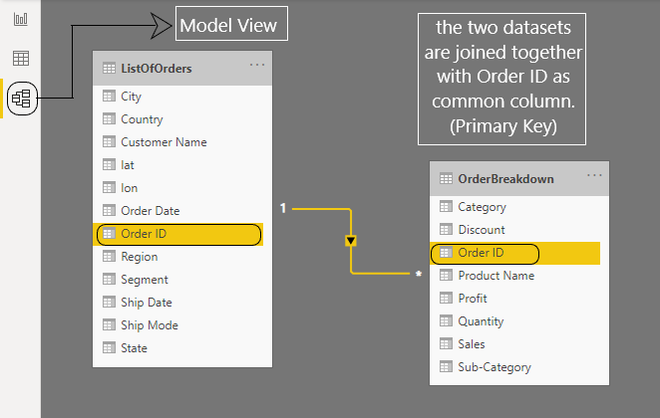
图 1:Power BI:连接黑白数据集
地图:
使用 Power BI 地图是一种可视化表示位置的数据的好方法。借助视觉上吸引人的地图和易于理解的内容,您的用户将能够更深入地了解您的数据。在 Power BI 中使用地图之前,我们需要首先了解如何在给定数据集中创建和使用层次结构。
Steps Involved:

Step 1 - Select and expand the 'ListOfOrders' dataset from Fields panel.
Step 2 - Select 'state' and 'city' columns one by one and drag and drop them
         into 'country' column.

This will create a new hierarchy column in the dataset. Rename it as 'Geography'.
(As showm in fig 2) 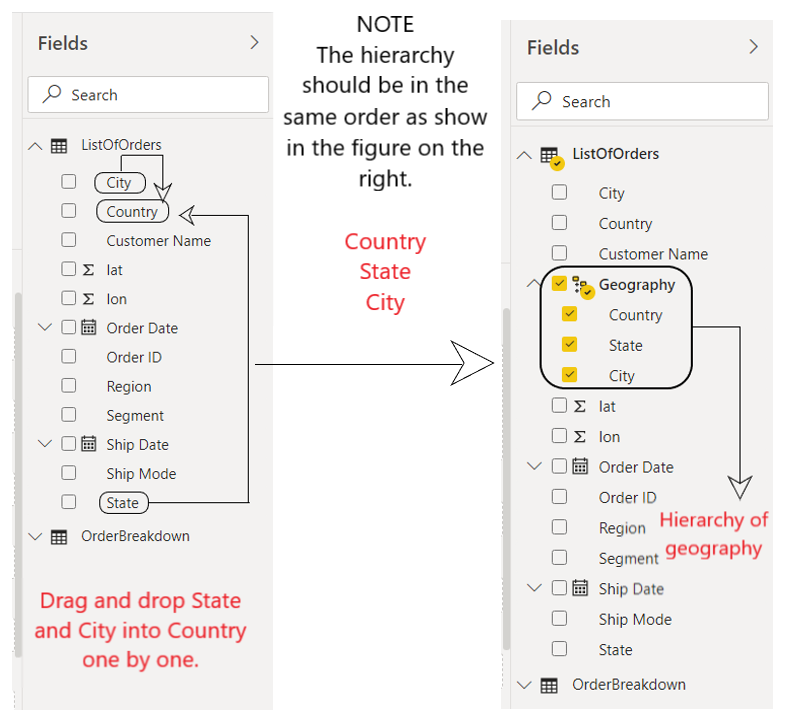
图 2:Power BI:创建层次结构
创建Geography层次结构后,请按照以下步骤在 Power BI 中创建地图。
Steps Involved:

Step 1 - Select 'Map' from Visualization panel and drag & drop it into report view.
Step 2 - Drag Geography from Fields panel and drop into the Location.
Step 3 - Drag lat and lon from Fields panel and drop into Langitude and Longitude.

(As shown in fig 3)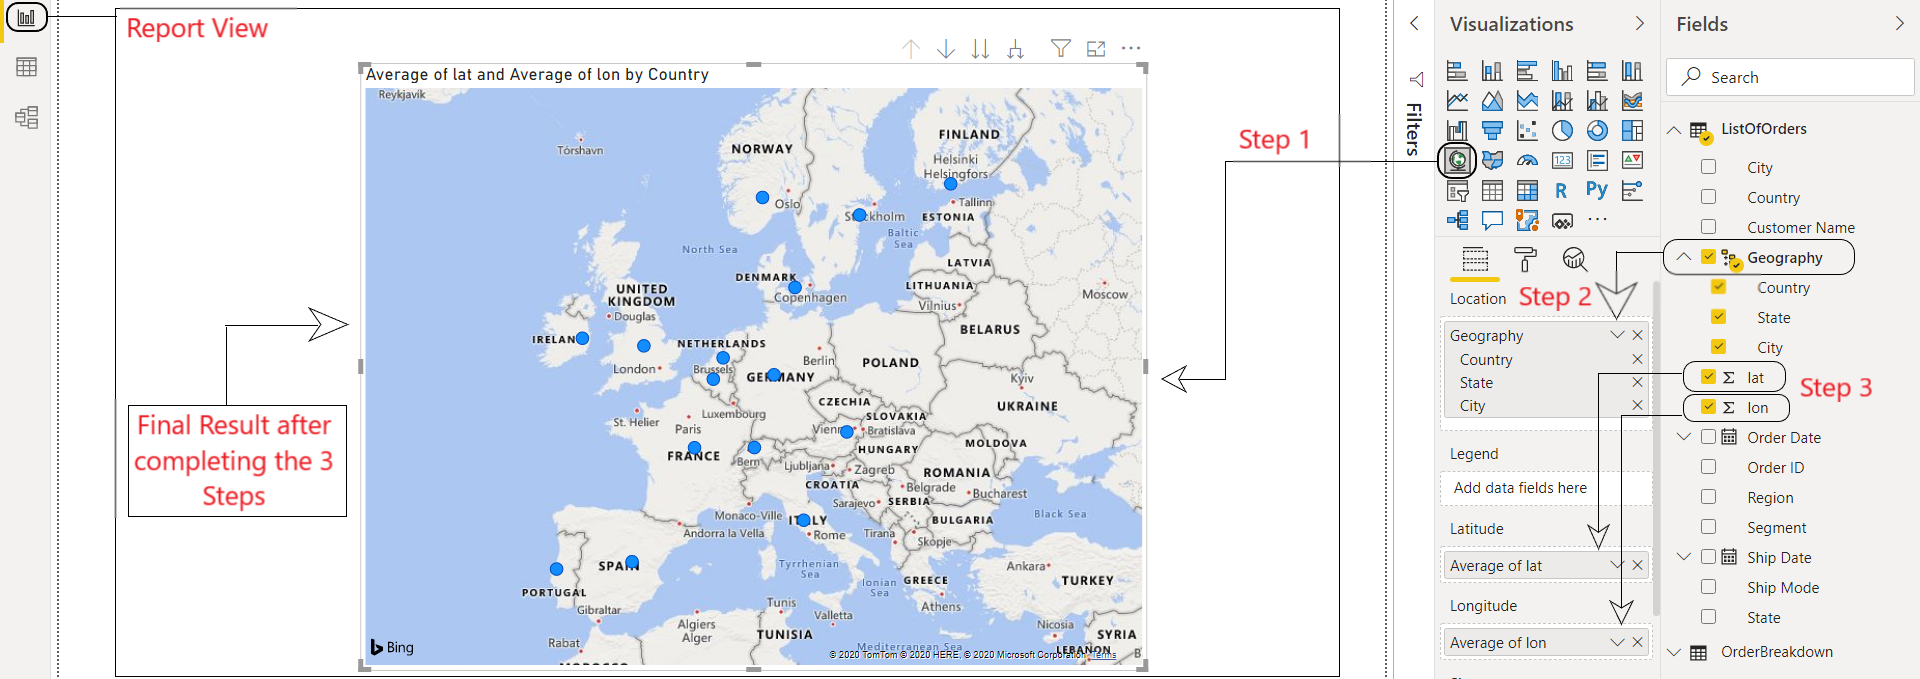
图 3:Power BI:地图
如果我们对这张地图进行钻取并将级别向下扩展到层次结构,我们也可以了解数据集中涉及的州和城市。 (如图4所示)

图 4:Power BI:钻取层次结构
计算列与计算度量:
Calculated Columns Calculated Measures A new column based on calculations done on the existing column. A visual column created when used in a particular visualization. (Dynamically created) It is created before Aggregation task is done on the dataset. It is created after Aggregation task is done on the dataset. Once created, it is stored in the dataset. It is not stored in the dataset after creation. Can be used when need the value for formatting purposes (i.e. slicers, roe/column category). Can be used when needed to apply any aggregation to a value (i.e. sum, average etc) that shows a result.
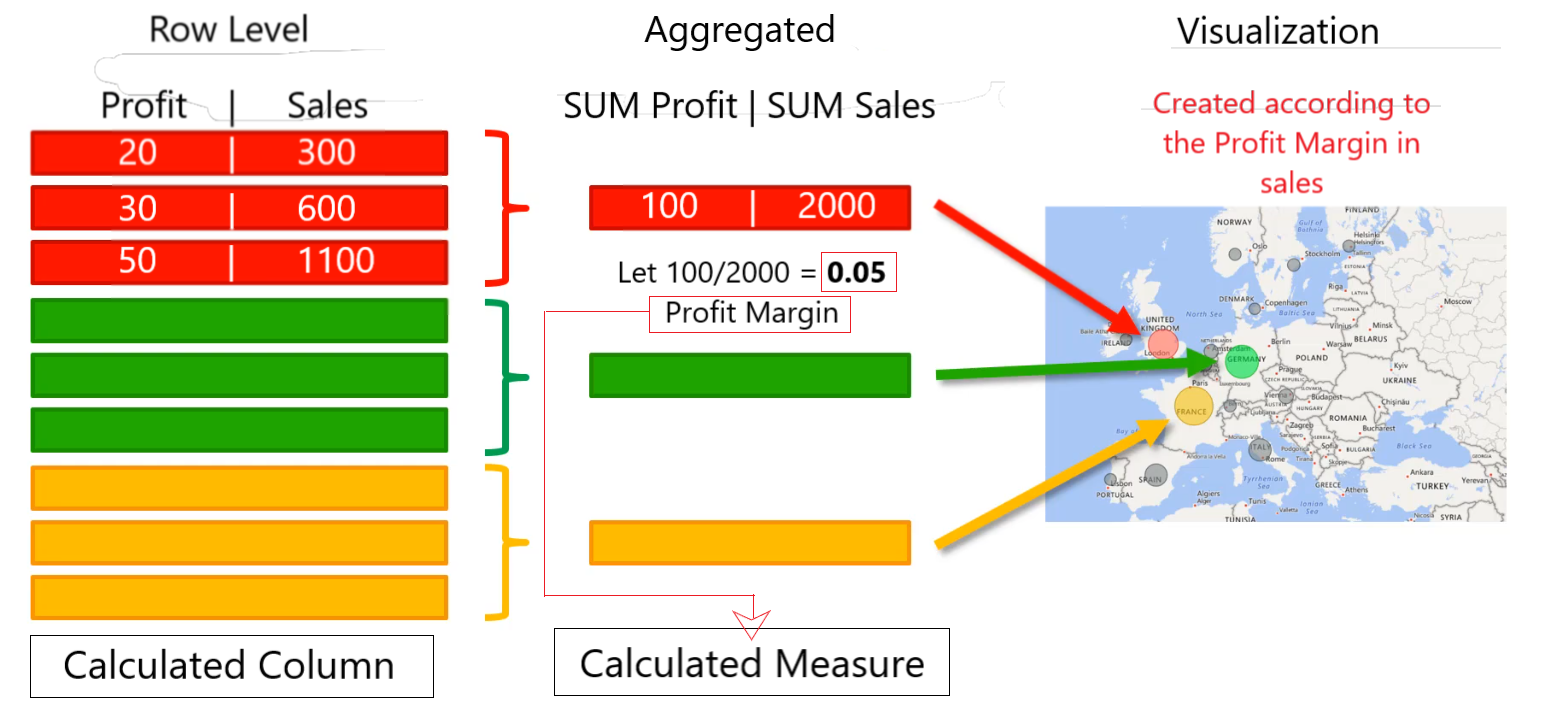
图 5:Power BI:列与度量
现在我们了解了 Column 和 Measure 之间的主要区别,让我们创建一个我们自己的计算度量。
Steps Involved

Step 1 - Go to 'OrderBreakdown' dataset in Fields panel and exapnd it.
Step 2 - Right click on it and click on 'New Measure'.
Step 3 - Now go the 'Formula Bar' under the Power BI Ribbon and type the following code.
![]()
This will create a calculated measure (ProfitMargin) in the OrderBreakdown dataset. (as shown in Fig 6)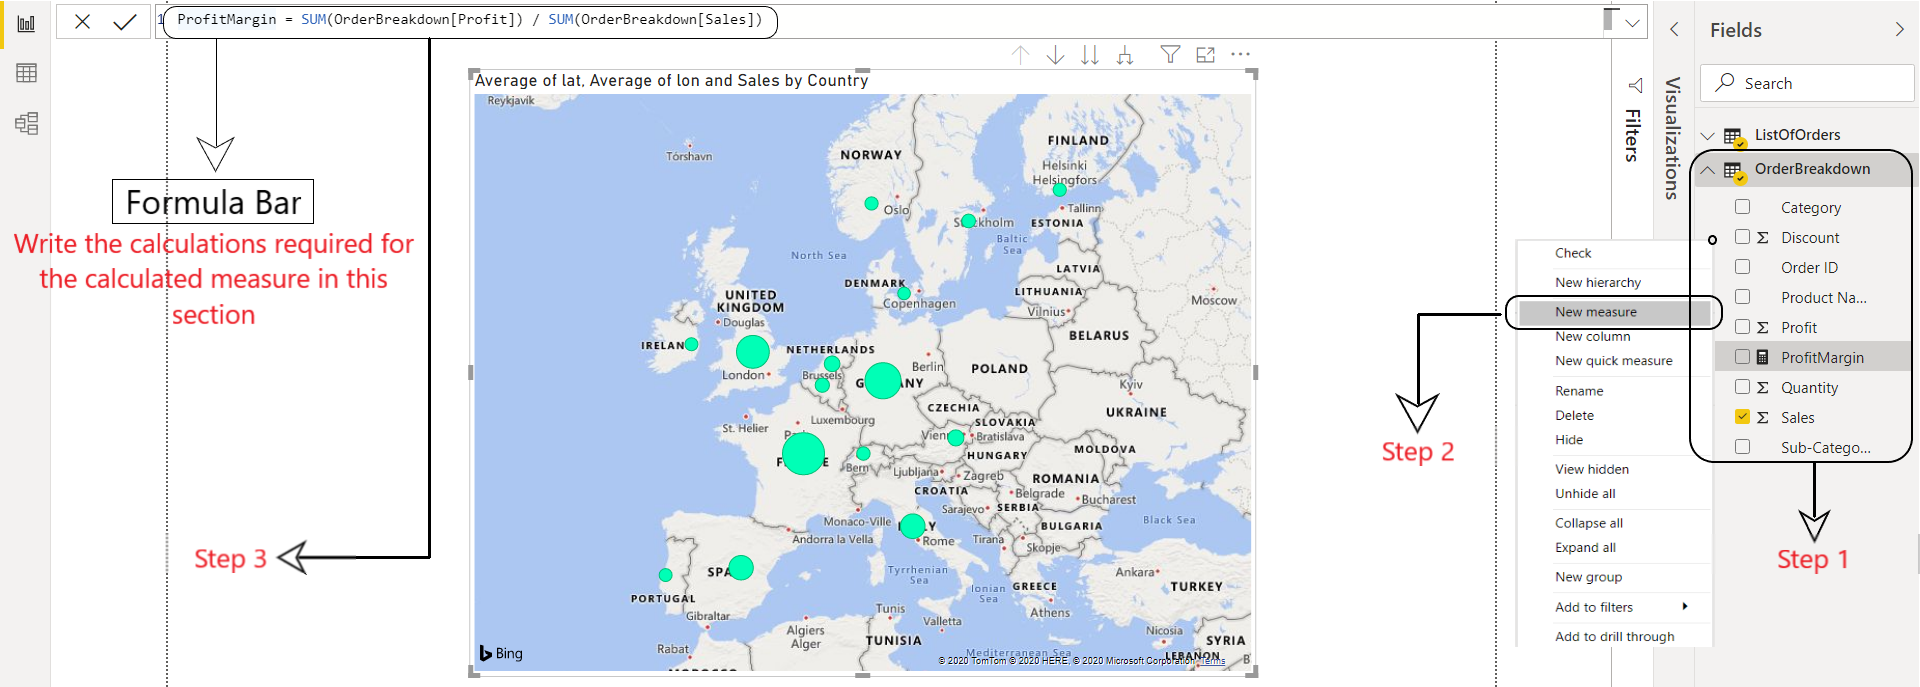
图 6:Power BI:创建计算度量
散点图:
散点图或散点图是一种非常有用的工具,用于可视化两组数据之间的关系。它有两个价值轴来显示——
- 横轴:一组数值数据。
- 纵轴:一组数值。
Steps Involved:

Step 1 - Select the scatter chart from the Visualization panel and drag it into the report view.

Step 2 - From the Fields section, expand 'OrderBreakdown' dataset. Then drag and drop
    2.a - Sales to x-axis
    2.b - Profit to y-axis
     2.c - Customer Name to details

(As shown in Fig 7)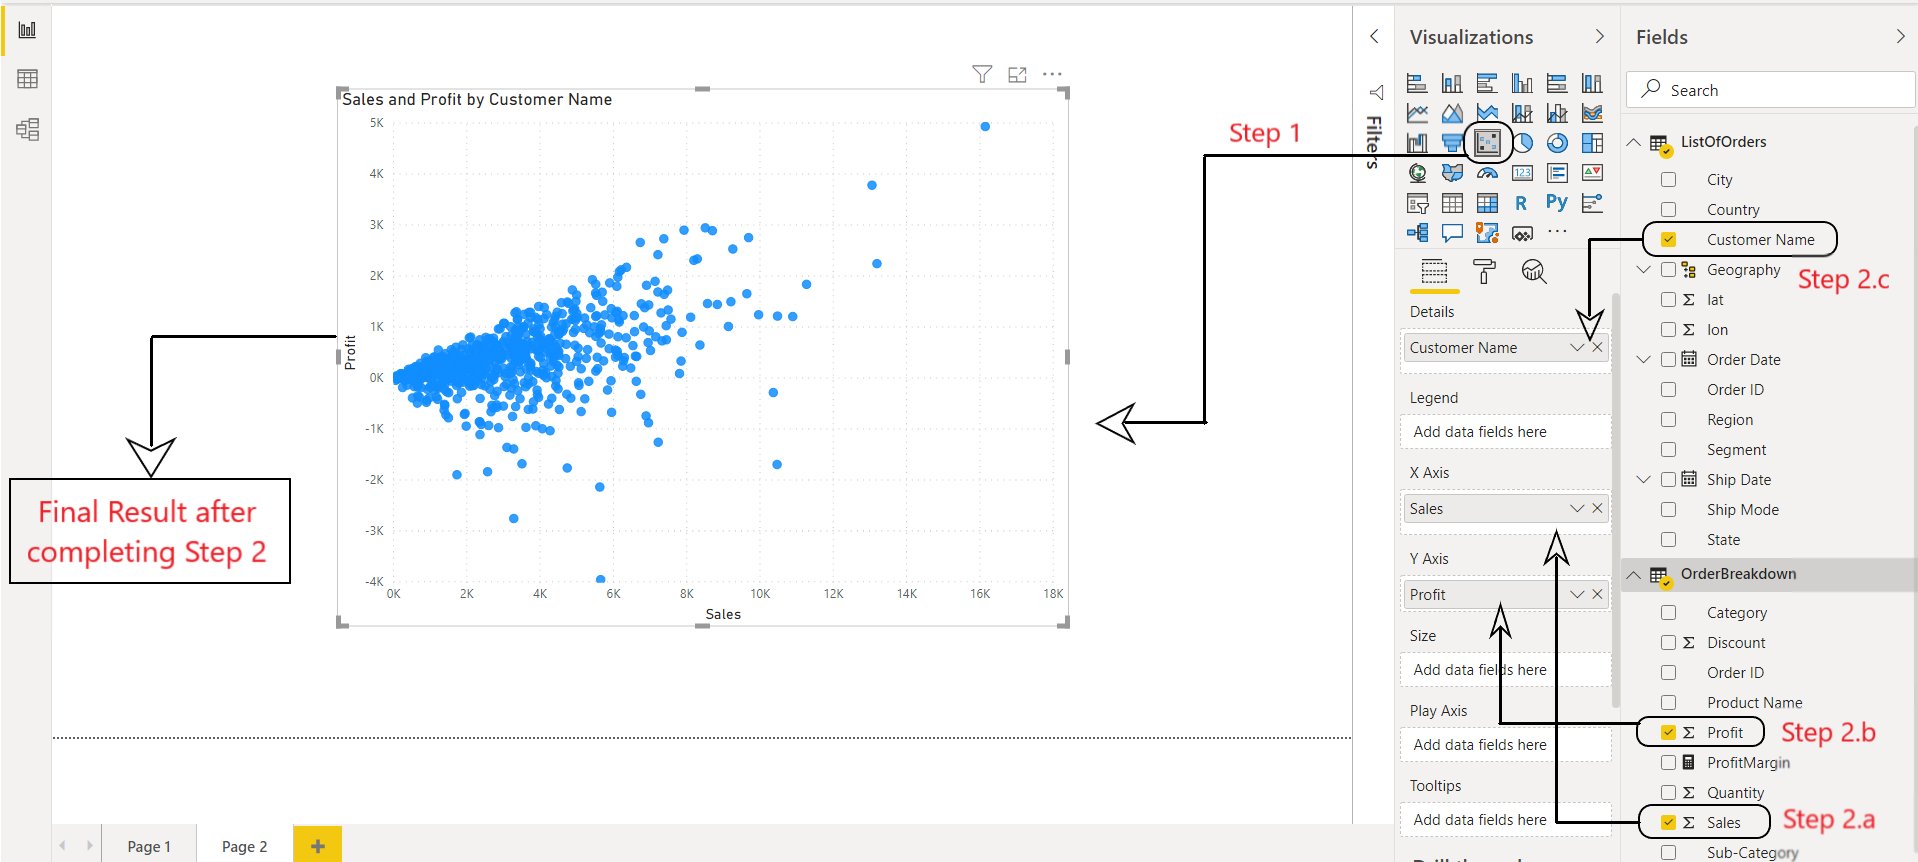
图 7:Power BI:散点图
Step 3 - Now, go to Format --> Data colors --> Default color --> Conditional formatting.

Step 4 - Do the following :
    4.a - Set Based on field to ProfitMargin.
     4.b - Set Min/Max colors for ProfitMargin.
     4.c - Press OK.

(As shown in fig 8)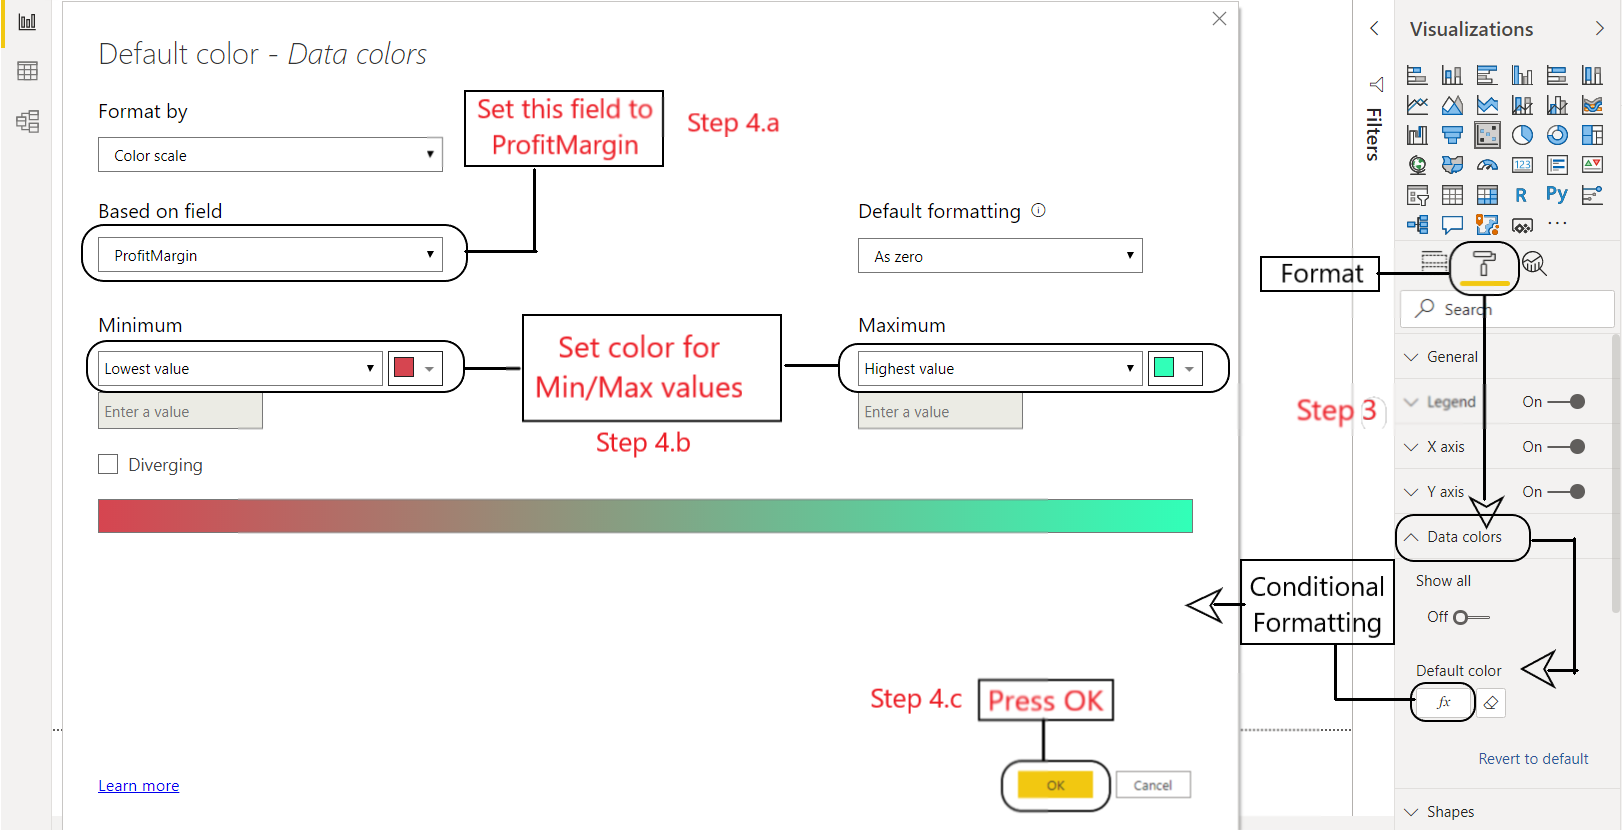
图 8:Power BI:条件格式
On following the above steps, we get a schematic, color coded Scatter plot. (As shown in Fig 9)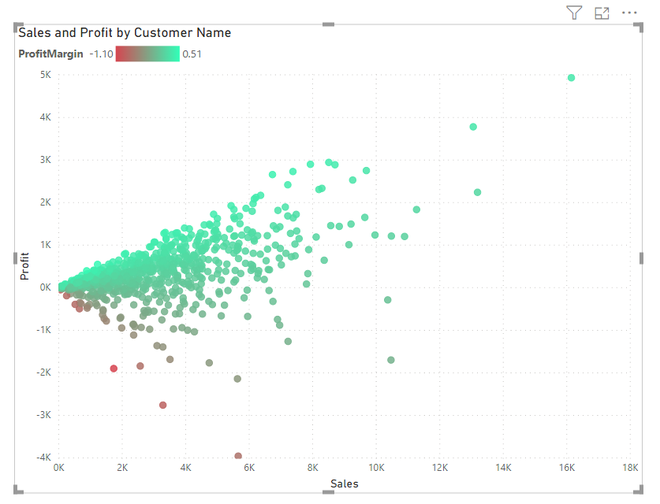
图 9:Power BI:格式化散点图
交互式商业智能报告简介:
交互式 BI 报告提供了一种在各种引人注目的交互式报告中显示 Excel 数据的新方法。您可以添加各种多重可视化以从报告中获取重要信息。这是一个包含地图、散点图、切片器和圆环图的示例 BI 报告。
Steps Involved:
Step 1 - Create a new page.
Step 2 - Simply copy your previous visualizations (Map and Scatter plot) and paste it onto the new page.
Step 3 - Drag and drop two slicers from Visualization pane. Then, from the 'ListOfOrders' dataset drag and drop :
    3.a - OrderDate into first slicer.
    3.b - Region into second slicer.

(As shown in Fig 10)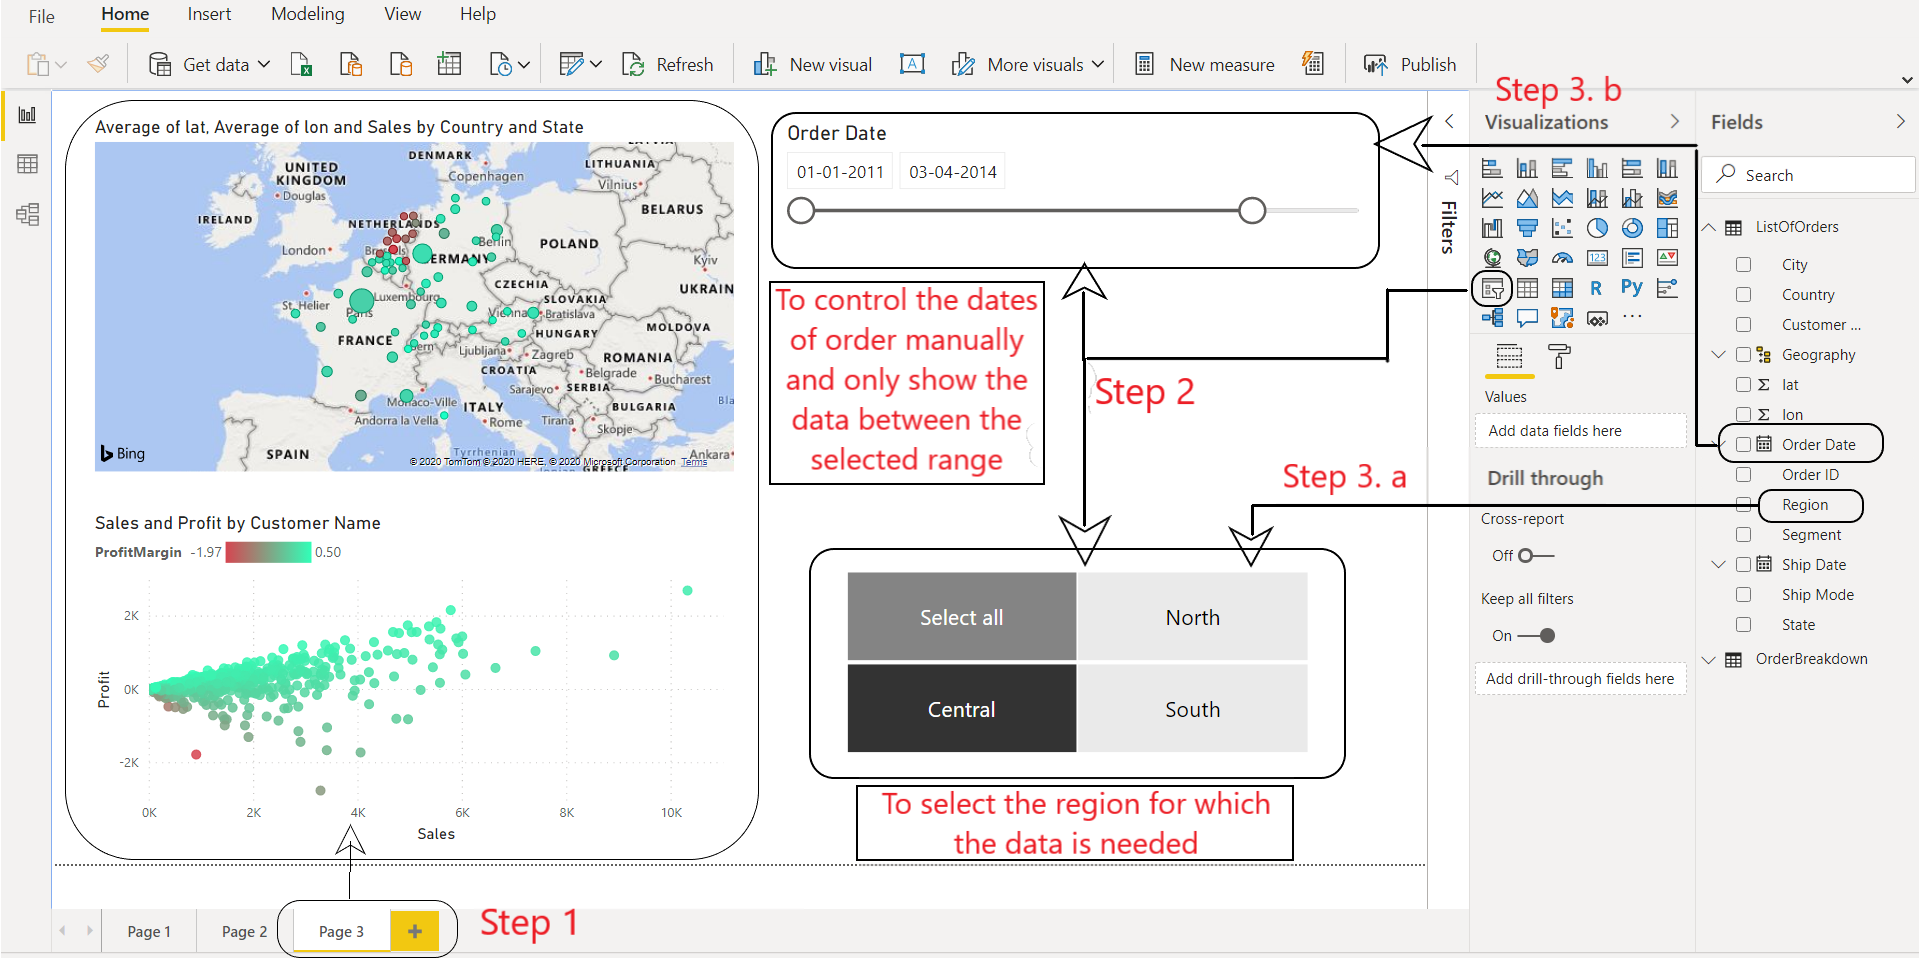
图 10:Power BI:交互式 BI 报告
Note: You can always go to the Format panel of each of these visualizations and change its aspects like Text size, color etc. as per your preferences.
甜甜圈图:
圆环图类似于饼图,因为它显示了部分与整体的关系。唯一的区别是中心是空白的,并为标签或图标留出空间。
Steps Involved:
Step 1 - Select 2 Donut chart from the Visualization panel and drag it into the Report view.
Step 2 - Select OrderDate from'ListOfOrders' dataset and drag it into the donut chart.
Step 3 - Select Profit from 'ListOfOrders' dataset and drag it into the values section.

(as shown in Fig 11) 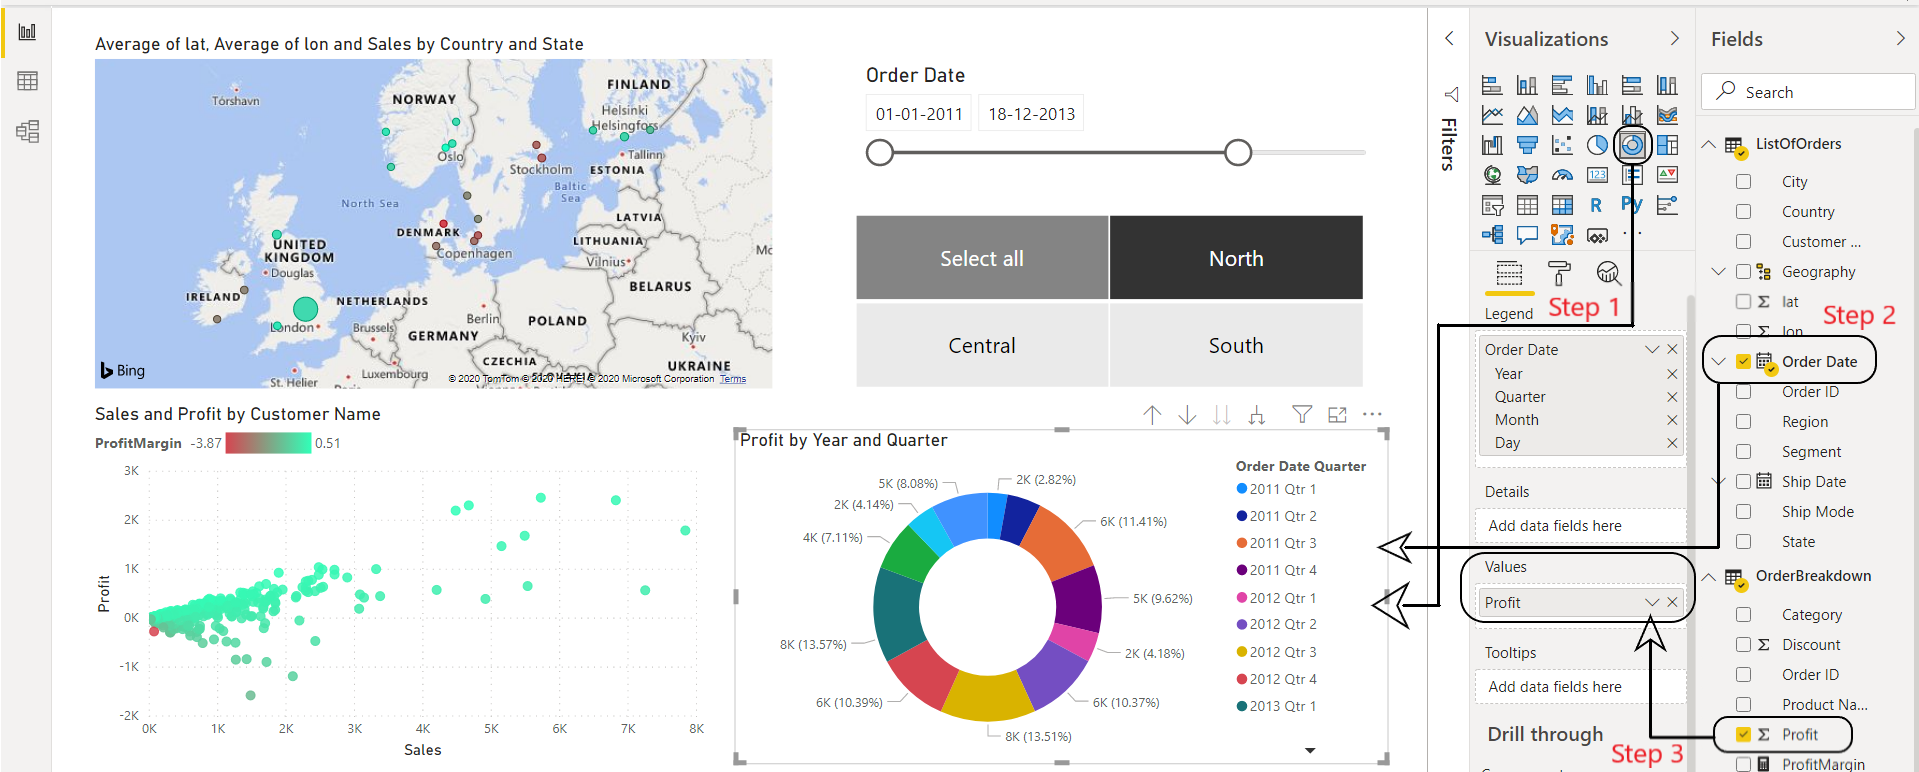
图 11:Power BI:圆环图
制作交互式 BI 报告是世界各地的商人用来做出重要公司决策的一项重要技能。以上是制作 Power BI 报告的示例之一。您可以使用各种可视化。将它们与过滤器和切片器结合使用,以创建您自己的商业智能报告。如有疑问/疑问,请在下方评论。