在 R 中用对数刻度绘制直方图
R是一种编程语言,主要用于统计计算和图形。它实现了各种统计技术,包括线性建模、分类、时间序列分析和聚类。直方图通常用于描述变量的频率分布。它也常用于汇总连续和离散数据。与频率由条形高度表示的条形图不同,这里的频率由条形面积表示。
在本文中,我们将看到如何在 R 编程语言中绘制具有对数刻度的直方图。
方法 1:使用基础 R
hist()函数用于创建直方图。
句法:
Syntax : hist( v, main, xlab, xlim, ylim, breaks, col, border)
如果我们想将直方图的值转换为对数刻度,我们可以使用hist()函数中的log()函数,如下所示:
hist(log(v))
- v : The vector containing the numeric values to be used in histogram.
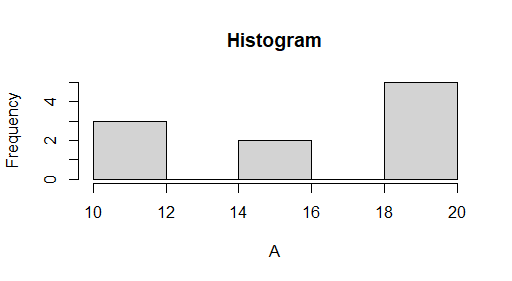
示例 1:创建法线直方图
使用包含直方图要使用的数值的向量“ A” 。使用hist()函数绘制向量“ A ”,使用主参数将图的标题设置为“直方图”。
R
# Code for Plotting A Normal Histogram
# Create data for the Histogram
A <- c(10, 10, 10, 20, 15,
       15, 20, 20, 20, 20)

# Plot the histogram
hist(A, main = "Histogram")
R
# Code for Plotting A Histogram in
# the Logarithmic Scale

# Create data for the Histogram
A <- c(10, 10, 10, 20, 20,
       20, 20, 20, 30, 30)

# Plot the histogram
hist(log(A), main = "Histogram",
     col = "green", border = "red",
     xlab = "Logarithmic Scale")
R
library("ggplot2")

# Code for Plotting A Histogram in
# the Logarithmic Scale

# Create data for the Histogram
A <- c(10, 10, 10, 20, 15,
       15, 20, 20, 20, 20)

# Plot the histogram
# The bins parameter divides the plot
# into 5 parts/bars
ggplot(data.frame(A), aes(A)) + geom_histogram(bins = 5)
R
library("ggplot2")


# Code for Plotting A Histogram in
# the Logarithmic Scale

# Create data for the Histogram
A <- c(10, 10, 10, 20, 15,
       15, 20, 20, 20, 20)

# Plot the histogram
# The bins parameter divides the plot
# into 5 parts/bars
ggplot(data.frame(log(A)),
       aes(log(A))) + geom_histogram(bins = 5)
R
library("ggplot2")


# Code for Plotting A Histogram in
# the Logarithmic Scale

# Create data for the Histogram
A <- c(10, 10, 10, 20, 15,
       15, 20, 20, 20, 20)

# Plot the histogram
# The bins parameter divides the
# plot into 6 parts/bars
ggplot(data.frame(A), aes(A)) +
geom_histogram(color = "red", fill = "green", bins = 6) +
scale_x_log10()
输出:
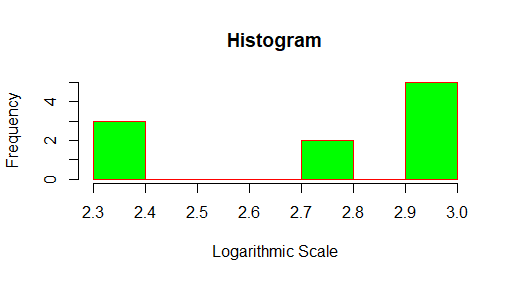
示例 2:在 R 中使用对数刻度创建直方图
使用包含直方图要使用的数值的向量“ A ”,使用hist()函数内的log()函数绘制向量“ A ”。
绘图的标题设置为“直方图”,条形的颜色设置为“绿色”,条形的边框颜色设置为“红色”,xlabel 设置为“对数刻度”,使用 main、col 、边界、xlab 参数分别。
代码:
电阻
# Code for Plotting A Histogram in
# the Logarithmic Scale

# Create data for the Histogram
A <- c(10, 10, 10, 20, 20,
       20, 20, 20, 30, 30)

# Plot the histogram
hist(log(A), main = "Histogram",
     col = "green", border = "red",
     xlab = "Logarithmic Scale")
输出:
方法二:使用ggplot2包
使用install.packages()安装ggplot2包并使用 library() 加载ggplot2包。
# Install & load ggplot2 package
install.packages("ggplot2")
library("ggplot2")
ggplot2 是一个专用于数据可视化的 R 包。使用 ggplot2 包,我们可以绘制几乎任何类型的图表。
Syntax: ggplot(data.frame(x), aes(x)) + geom_histogram()
- x is the vector which contains the numerical values to be used by the histogram.
- data.frame(x) creates a data frame from the given data
- aes(x) is often used within other graphing elements to specify the desired aesthetics
- geom_histogram() is used to plot the histogram
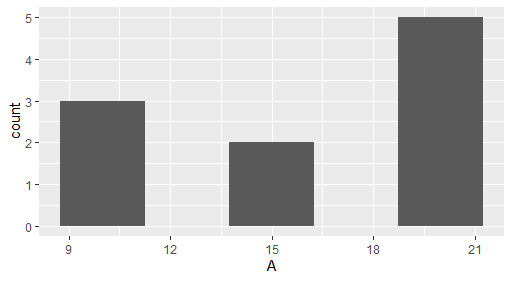
创建一个正常的直方图:
- 使用包含直方图要使用的数值的向量“ A ”。
- 使用函数ggplot()函数和geom_histogram()函数绘制直方图
例子:
电阻
library("ggplot2")

# Code for Plotting A Histogram in
# the Logarithmic Scale

# Create data for the Histogram
A <- c(10, 10, 10, 20, 15,
       15, 20, 20, 20, 20)

# Plot the histogram
# The bins parameter divides the plot
# into 5 parts/bars
ggplot(data.frame(A), aes(A)) + geom_histogram(bins = 5)
输出:
方法三:使用ggplot2包和log()函数。
如果我们想将直方图的值转换为对数刻度,我们可以使用ggplot()和geom_histogram()函数中的log ()函数,如下所示:
Syntax: ggplot(data.frame(log(x)), aes(log(x))) + geom_histogram()
- x is the vector which contains the numerical values to be used by the histogram.
- data.frame(log(x)) creates a data frame from log(x)
- aes(log(x)) is often used within other graphing elements to specify the desired aesthetics
- geom_histogram() is used to plot the histogram
使用包含直方图要使用的数值的向量“ A ”。使用log()函数将 x 轴转换为对数刻度,使用ggplot()函数、 log()函数和geom_histogram()函数绘制向量“ A ”。条的颜色设置为绿色,边框颜色分别使用填充和颜色设置为红色。
电阻
library("ggplot2")


# Code for Plotting A Histogram in
# the Logarithmic Scale

# Create data for the Histogram
A <- c(10, 10, 10, 20, 15,
       15, 20, 20, 20, 20)

# Plot the histogram
# The bins parameter divides the plot
# into 5 parts/bars
ggplot(data.frame(log(A)),
       aes(log(A))) + geom_histogram(bins = 5)
输出:
方法四:使用ggplot2包和scale_x_log10()函数。
如果我们想将直方图的值转换为对数刻度,我们可以使用 scale_x_log10()函数以及 ggplot() 和 geom_histogram()函数,如下所示:
Syntax: ggplot(data.frame(x), aes(x)) + geom_histogram() + scale_x_log10()
Parameters:
- x is the vector which contains the numerical values to be used by the histogram.
- data.frame(x) creates a data frame from x.
- aes(x) is often used within other graphing elements to specify the desired aesthetics
- geom_histogram() is used to plot the histogram
- scale_x_log10() is used to convert the x-axis to logarithmic scale
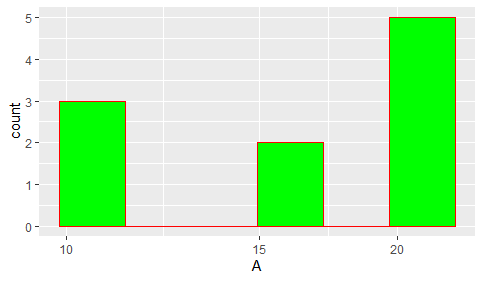
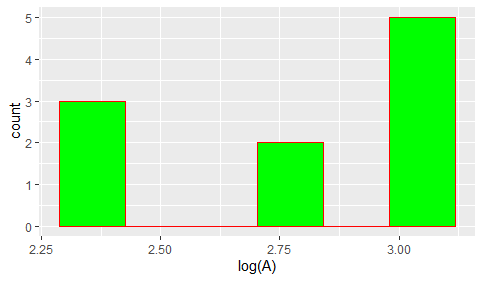
使用包含直方图要使用的数值的向量“ A ”。使用ggplot()函数、 scale_x_log10()函数和geom_histogram()函数绘制向量“ A ”,条形的颜色设置为绿色,边框颜色分别使用填充和颜色设置为红色。
电阻
library("ggplot2")


# Code for Plotting A Histogram in
# the Logarithmic Scale

# Create data for the Histogram
A <- c(10, 10, 10, 20, 15,
       15, 20, 20, 20, 20)

# Plot the histogram
# The bins parameter divides the
# plot into 6 parts/bars
ggplot(data.frame(A), aes(A)) +
geom_histogram(color = "red", fill = "green", bins = 6) +
scale_x_log10()
输出: